
Calgary Flames at Dallas Stars
· National Hockey League
<span id="gameStatus" class="badge bg-danger" style="font-size: 1.2em; margin: 5px 0;">Final</span>
6 - 5
6 - 5

Regular Season Series
CGY leads series 1-0
Scoring Summary
 |
Goal | 1st Period 0:25 | Goal scored by Andrew Mangiapane assisted by Mikael Backlund and Blake Coleman |
|
Goal | 1st Period 8:10 | Goal scored by Trevor Lewis assisted by MacKenzie Weegar and Chris Tanev (PPG) |
 |
Goal | 1st Period 15:34 | Goal scored by Jamie Benn assisted by Ty Dellandrea and Ryan Suter (SHG) |
|
Goal | 2nd Period 10:54 | Goal scored by Elias Lindholm assisted by Tyler Toffoli and Rasmus Andersson (PPG) |
|
Goal | 2nd Period 13:07 | Goal scored by Nazem Kadri assisted by Jonathan Huberdeau and Michael Stone |
|
Goal | 2nd Period 16:38 | Goal scored by Rasmus Andersson assisted by Nazem Kadri and Jonathan Huberdeau |
|
Goal | 2nd Period 17:57 | Goal scored by Chris Tanev assisted by MacKenzie Weegar |
|
Goal | 2nd Period 19:14 | Goal scored by Tyler Seguin assisted by Jason Robertson and Joe Pavelski |
|
Goal | 3rd Period 7:19 | Goal scored by Joe Pavelski assisted by Jason Robertson and Esa Lindell |
|
Goal | 3rd Period 12:54 | Goal scored by Joe Pavelski assisted by Miro Heiskanen and Tyler Seguin |
|
Goal | 3rd Period 15:23 | Goal scored by Colin Miller assisted by Miro Heiskanen |
Statistics
 CGY CGY |
 DAL DAL |
|
|---|---|---|
| 12 | Blocked Shots | 17 |
| 22 | Hits | 29 |
| 6 | Takeaways | 7 |
| 36 | Shots | 33 |
| 2 | Power Play Goals | 0 |
| 5 | Power Play Opportunities | 2 |
| 40.0 | Power Play Percentage | 0.0 |
| 0 | Short Handed Goals | 1 |
| 0 | Shootout Goals | 0 |
| 33 | Faceoffs Won | 32 |
| 50.8 | Faceoff Win Percent | 49.2 |
| 7 | Giveaways | 14 |
| 2 | Total Penalties | 5 |
| 4 | Penalty Minutes | 10 |
 Dallas Stars Injuries
| NAME, POS | STATUS | DATE |
|---|---|---|
| Arttu Hyry, RW | Out | Jul 1 |
| Roope Hintz, C | Out | May 4 |
| Tyler Seguin, C | Injured Reserve | May 4 |
| Nils Lundkvist, D | Out | Apr 29 |
 Calgary Flames Injuries
| NAME, POS | STATUS | DATE |
|---|---|---|
| Kevin Bahl, D | Out | Apr 16 |
| Connor Zary, C | Out | Apr 16 |
| Yan Kuznetsov, D | Out | Apr 14 |
| Joel Hanley, D | Out | Mar 28 |
| Samuel Honzek, LW | Injured Reserve | Mar 27 |
Game Information
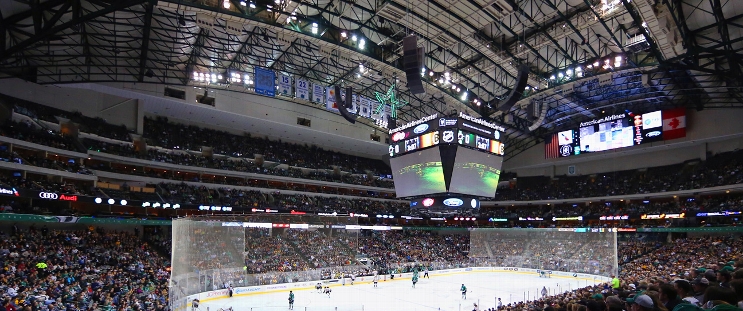 American Airlines Center
Location: Dallas, TX
Attendance: 18,532 | Capacity:
American Airlines Center
Location: Dallas, TX
Attendance: 18,532 | Capacity:
2025-26 Pacific Division Standings
| TEAM | W | L | PTS | OTL |
|---|---|---|---|---|
| <img src="https://a.espncdn.com/i/teamlogos/nhl/500/vgk.png" style="padding: 0 4px; width: 25px; vertical-align: inherit;">Vegas | 39 | 26 | 95 | 17 |
| <img src="https://a.espncdn.com/i/teamlogos/nhl/500/edm.png" style="padding: 0 4px; width: 25px; vertical-align: inherit;">Edmonton | 41 | 30 | 93 | 11 |
| <img src="https://a.espncdn.com/i/teamlogos/nhl/500/ana.png" style="padding: 0 4px; width: 25px; vertical-align: inherit;">Anaheim | 43 | 33 | 92 | 6 |
| <img src="https://a.espncdn.com/i/teamlogos/nhl/500/la.png" style="padding: 0 4px; width: 25px; vertical-align: inherit;">Los Angeles | 35 | 27 | 90 | 20 |
| <img src="https://a.espncdn.com/i/teamlogos/nhl/500/sj.png" style="padding: 0 4px; width: 25px; vertical-align: inherit;">San Jose | 39 | 35 | 86 | 8 |
| <img src="https://a.espncdn.com/i/teamlogos/nhl/500/sea.png" style="padding: 0 4px; width: 25px; vertical-align: inherit;">Seattle | 34 | 37 | 79 | 11 |
| <img src="https://a.espncdn.com/i/teamlogos/nhl/500/cgy.png" style="padding: 0 4px; width: 25px; vertical-align: inherit;">Calgary | 34 | 39 | 77 | 9 |
| <img src="https://a.espncdn.com/i/teamlogos/nhl/500/van.png" style="padding: 0 4px; width: 25px; vertical-align: inherit;">Vancouver | 25 | 49 | 58 | 8 |
2025-26 Central Division Standings
| TEAM | W | L | PTS | OTL |
|---|---|---|---|---|
| <img src="https://a.espncdn.com/i/teamlogos/nhl/500/col.png" style="padding: 0 4px; width: 25px; vertical-align: inherit;">Colorado | 55 | 16 | 121 | 11 |
| <img src="https://a.espncdn.com/i/teamlogos/nhl/500/dal.png" style="padding: 0 4px; width: 25px; vertical-align: inherit;">Dallas | 50 | 20 | 112 | 12 |
| <img src="https://a.espncdn.com/i/teamlogos/nhl/500/min.png" style="padding: 0 4px; width: 25px; vertical-align: inherit;">Minnesota | 46 | 24 | 104 | 12 |
| <img src="https://a.espncdn.com/i/teamlogos/nhl/500/uta.png" style="padding: 0 4px; width: 25px; vertical-align: inherit;">Utah | 43 | 33 | 92 | 6 |
| <img src="https://a.espncdn.com/i/teamlogos/nhl/500/stl.png" style="padding: 0 4px; width: 25px; vertical-align: inherit;">St. Louis | 37 | 33 | 86 | 12 |
| <img src="https://a.espncdn.com/i/teamlogos/nhl/500/nsh.png" style="padding: 0 4px; width: 25px; vertical-align: inherit;">Nashville | 38 | 34 | 86 | 10 |
| <img src="https://a.espncdn.com/i/teamlogos/nhl/500/wpg.png" style="padding: 0 4px; width: 25px; vertical-align: inherit;">Winnipeg | 35 | 35 | 82 | 12 |
| <img src="https://a.espncdn.com/i/teamlogos/nhl/500/chi.png" style="padding: 0 4px; width: 25px; vertical-align: inherit;">Chicago | 29 | 39 | 72 | 14 |