
San Jose Sharks at Florida Panthers
· National Hockey League
<span id="gameStatus" class="badge bg-danger" style="font-size: 1.2em; margin: 5px 0;">Final</span>
1 - 4
1 - 4

Regular Season Series
FLA wins series 2-0
Scoring Summary
 |
Goal | 1st Period 5:49 | Alexander Barabanov Goal (8) Wrist Shot, assists: Erik Karlsson (53) |
 |
Goal | 2nd Period 4:30 | Sam Reinhart Goal (18) Wrist Shot, assists: Marc Staal (6) |
|
Goal | 2nd Period 19:19 | Sam Reinhart Goal (19) Tip-In, assists: Eetu Luostarinen (13), Anton Lundell (16) |
|
Goal | 3rd Period 18:21 | Eric Staal Goal (9) Wrist Shot, assists: Eetu Luostarinen (14) |
|
Goal | 3rd Period 18:55 | Eric Staal Goal (10) Wrist Shot, assists: none |
Statistics
 SJ SJ |
 FLA FLA |
|
|---|---|---|
| 16 | Blocked Shots | 12 |
| 17 | Hits | 28 |
| 12 | Takeaways | 15 |
| 34 | Shots | 42 |
| 0 | Power Play Goals | 0 |
| 3 | Power Play Opportunities | 1 |
| 0.0 | Power Play Percentage | 0.0 |
| 0 | Short Handed Goals | 2 |
| 0 | Shootout Goals | 0 |
| 33 | Faceoffs Won | 31 |
| 51.6 | Faceoff Win Percent | 48.4 |
| 9 | Giveaways | 6 |
| 2 | Total Penalties | 3 |
| 7 | Penalty Minutes | 11 |
 Florida Panthers Injuries
| NAME, POS | STATUS | DATE |
|---|---|---|
| Radko Gudas, D | Out | Jul 1 |
| Jacob Markstrom, G | Out | Jun 30 |
| Carter Verhaeghe, C | Out | Apr 15 |
| Sam Bennett, C | Out | Apr 15 |
| Gustav Forsling, D | Out | Apr 15 |
 San Jose Sharks Injuries
| NAME, POS | STATUS | DATE |
|---|---|---|
| Ryan Reaves, RW | Out | Apr 10 |
| Logan Couture, C | Injured Reserve | Sep 30 |
Game Information
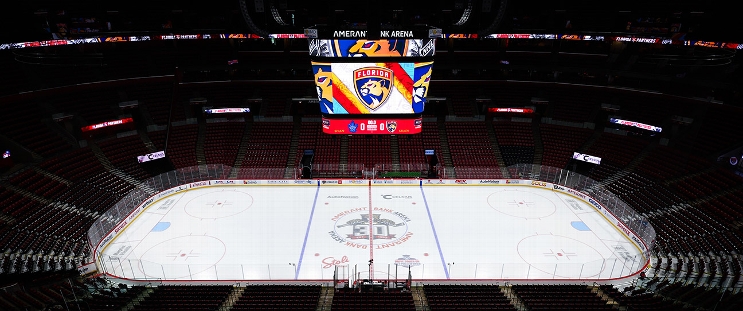 Amerant Bank Arena
Location: Sunrise, FL
Attendance: 15,183 | Capacity:
Amerant Bank Arena
Location: Sunrise, FL
Attendance: 15,183 | Capacity:
2025-26 Pacific Division Standings
| TEAM | W | L | PTS | OTL |
|---|---|---|---|---|
| <img src="https://a.espncdn.com/i/teamlogos/nhl/500/vgk.png" style="padding: 0 4px; width: 25px; vertical-align: inherit;">Vegas | 39 | 26 | 95 | 17 |
| <img src="https://a.espncdn.com/i/teamlogos/nhl/500/edm.png" style="padding: 0 4px; width: 25px; vertical-align: inherit;">Edmonton | 41 | 30 | 93 | 11 |
| <img src="https://a.espncdn.com/i/teamlogos/nhl/500/ana.png" style="padding: 0 4px; width: 25px; vertical-align: inherit;">Anaheim | 43 | 33 | 92 | 6 |
| <img src="https://a.espncdn.com/i/teamlogos/nhl/500/la.png" style="padding: 0 4px; width: 25px; vertical-align: inherit;">Los Angeles | 35 | 27 | 90 | 20 |
| <img src="https://a.espncdn.com/i/teamlogos/nhl/500/sj.png" style="padding: 0 4px; width: 25px; vertical-align: inherit;">San Jose | 39 | 35 | 86 | 8 |
| <img src="https://a.espncdn.com/i/teamlogos/nhl/500/sea.png" style="padding: 0 4px; width: 25px; vertical-align: inherit;">Seattle | 34 | 37 | 79 | 11 |
| <img src="https://a.espncdn.com/i/teamlogos/nhl/500/cgy.png" style="padding: 0 4px; width: 25px; vertical-align: inherit;">Calgary | 34 | 39 | 77 | 9 |
| <img src="https://a.espncdn.com/i/teamlogos/nhl/500/van.png" style="padding: 0 4px; width: 25px; vertical-align: inherit;">Vancouver | 25 | 49 | 58 | 8 |
2025-26 Atlantic Division Standings
| TEAM | W | L | PTS | OTL |
|---|---|---|---|---|
| <img src="https://a.espncdn.com/i/teamlogos/nhl/500/buf.png" style="padding: 0 4px; width: 25px; vertical-align: inherit;">Buffalo | 50 | 23 | 109 | 9 |
| <img src="https://a.espncdn.com/i/teamlogos/nhl/500/tb.png" style="padding: 0 4px; width: 25px; vertical-align: inherit;">Tampa Bay | 50 | 26 | 106 | 6 |
| <img src="https://a.espncdn.com/i/teamlogos/nhl/500/mtl.png" style="padding: 0 4px; width: 25px; vertical-align: inherit;">Montreal | 48 | 24 | 106 | 10 |
| <img src="https://a.espncdn.com/i/teamlogos/nhl/500/bos.png" style="padding: 0 4px; width: 25px; vertical-align: inherit;">Boston | 45 | 27 | 100 | 10 |
| <img src="https://a.espncdn.com/i/teamlogos/nhl/500/ott.png" style="padding: 0 4px; width: 25px; vertical-align: inherit;">Ottawa | 44 | 27 | 99 | 11 |
| <img src="https://a.espncdn.com/i/teamlogos/nhl/500/det.png" style="padding: 0 4px; width: 25px; vertical-align: inherit;">Detroit | 41 | 31 | 92 | 10 |
| <img src="https://a.espncdn.com/i/teamlogos/nhl/500/fla.png" style="padding: 0 4px; width: 25px; vertical-align: inherit;">Florida | 40 | 38 | 84 | 4 |
| <img src="https://a.espncdn.com/i/teamlogos/nhl/500/tor.png" style="padding: 0 4px; width: 25px; vertical-align: inherit;">Toronto | 32 | 36 | 78 | 14 |