
St. Louis Blues at Columbus Blue Jackets
· National Hockey League
<span id="gameStatus" class="badge bg-danger" style="font-size: 1.2em; margin: 5px 0;">Final</span>
0 - 7
0 - 7

Scoring Summary
 |
Goal | 1st Period 1:03 | Goal scored by Patrik Laine assisted by Zach Werenski and Andrew Peeke |
|
Goal | 1st Period 12:03 | Goal scored by Yegor Chinakhov assisted by Jakub Voracek |
|
Goal | 1st Period 13:56 | Goal scored by Jack Roslovic assisted by Sean Kuraly and Andrew Peeke (SHG) |
|
Goal | 2nd Period 5:30 | Goal scored by Zach Werenski assisted by Johnny Gaudreau and Boone Jenner |
|
Goal | 2nd Period 12:33 | Goal scored by Jakub Voracek assisted by Andrew Peeke and Yegor Chinakhov |
|
Goal | 3rd Period 6:00 | Goal scored by Cole Sillinger assisted by Justin Danforth and Vladislav Gavrikov |
|
Goal | 3rd Period 9:21 | Goal scored by Justin Danforth assisted by Kent Johnson and Andrew Peeke |
Statistics
 STL STL |
 CBJ CBJ |
|
|---|---|---|
| 13 | Blocked Shots | 6 |
| 9 | Hits | 21 |
| 2 | Takeaways | 1 |
| 24 | Shots | 33 |
| 0 | Power Play Goals | 0 |
| 2 | Power Play Opportunities | 2 |
| 0.0 | Power Play Percentage | 0.0 |
| 0 | Short Handed Goals | 0 |
| 0 | Shootout Goals | 0 |
| 24 | Faceoffs Won | 31 |
| 43.6 | Faceoff Win Percent | 56.4 |
| 3 | Giveaways | 4 |
| 3 | Total Penalties | 3 |
| 9 | Penalty Minutes | 9 |
 Columbus Blue Jackets Injuries
| NAME, POS | STATUS | DATE |
|---|---|---|
| Isac Lundestrom, C | Out | Jul 19 |
 St. Louis Blues Injuries
| NAME, POS | STATUS | DATE |
|---|---|---|
| Brandon Carlo, D | Out | Jun 27 |
Game Information
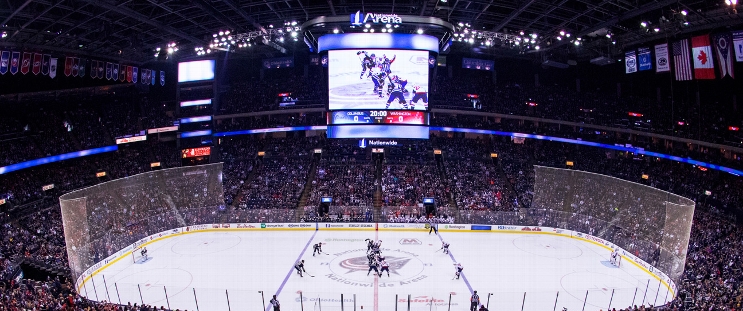 Nationwide Arena
Location: Columbus, OH
Attendance: 12,110 | Capacity:
Nationwide Arena
Location: Columbus, OH
Attendance: 12,110 | Capacity:
2025-26 Central Division Standings
| TEAM | W | L | PTS | OTL |
|---|---|---|---|---|
| <img src="https://a.espncdn.com/i/teamlogos/nhl/500/col.png" style="padding: 0 4px; width: 25px; vertical-align: inherit;">Colorado | 55 | 16 | 121 | 11 |
| <img src="https://a.espncdn.com/i/teamlogos/nhl/500/dal.png" style="padding: 0 4px; width: 25px; vertical-align: inherit;">Dallas | 50 | 20 | 112 | 12 |
| <img src="https://a.espncdn.com/i/teamlogos/nhl/500/min.png" style="padding: 0 4px; width: 25px; vertical-align: inherit;">Minnesota | 46 | 24 | 104 | 12 |
| <img src="https://a.espncdn.com/i/teamlogos/nhl/500/uta.png" style="padding: 0 4px; width: 25px; vertical-align: inherit;">Utah | 43 | 33 | 92 | 6 |
| <img src="https://a.espncdn.com/i/teamlogos/nhl/500/stl.png" style="padding: 0 4px; width: 25px; vertical-align: inherit;">St. Louis | 37 | 33 | 86 | 12 |
| <img src="https://a.espncdn.com/i/teamlogos/nhl/500/nsh.png" style="padding: 0 4px; width: 25px; vertical-align: inherit;">Nashville | 38 | 34 | 86 | 10 |
| <img src="https://a.espncdn.com/i/teamlogos/nhl/500/wpg.png" style="padding: 0 4px; width: 25px; vertical-align: inherit;">Winnipeg | 35 | 35 | 82 | 12 |
| <img src="https://a.espncdn.com/i/teamlogos/nhl/500/chi.png" style="padding: 0 4px; width: 25px; vertical-align: inherit;">Chicago | 29 | 39 | 72 | 14 |
2025-26 Metropolitan Division Standings
| TEAM | W | L | PTS | OTL |
|---|---|---|---|---|
| <img src="https://a.espncdn.com/i/teamlogos/nhl/500/car.png" style="padding: 0 4px; width: 25px; vertical-align: inherit;">Carolina | 53 | 22 | 113 | 7 |
| <img src="https://a.espncdn.com/i/teamlogos/nhl/500/pit.png" style="padding: 0 4px; width: 25px; vertical-align: inherit;">Pittsburgh | 41 | 25 | 98 | 16 |
| <img src="https://a.espncdn.com/i/teamlogos/nhl/500/phi.png" style="padding: 0 4px; width: 25px; vertical-align: inherit;">Philadelphia | 43 | 27 | 98 | 12 |
| <img src="https://a.espncdn.com/i/teamlogos/nhl/500/wsh.png" style="padding: 0 4px; width: 25px; vertical-align: inherit;">Washington | 43 | 30 | 95 | 9 |
| <img src="https://a.espncdn.com/i/teamlogos/nhl/500/cbj.png" style="padding: 0 4px; width: 25px; vertical-align: inherit;">Columbus | 40 | 30 | 92 | 12 |
| <img src="https://a.espncdn.com/i/teamlogos/nhl/500/nyi.png" style="padding: 0 4px; width: 25px; vertical-align: inherit;">NY Islanders | 43 | 34 | 91 | 5 |
| <img src="https://a.espncdn.com/i/teamlogos/nhl/500/nj.png" style="padding: 0 4px; width: 25px; vertical-align: inherit;">New Jersey | 42 | 37 | 87 | 3 |
| <img src="https://a.espncdn.com/i/teamlogos/nhl/500/nyr.png" style="padding: 0 4px; width: 25px; vertical-align: inherit;">NY Rangers | 34 | 39 | 77 | 9 |