
Boston Bruins at Detroit Red Wings
· National Hockey League
<span id="gameStatus" class="badge bg-danger" style="font-size: 1.2em; margin: 5px 0;">Final</span>
4 - 5
4 - 5

Regular Season Series
Series tied 1-1
Scoring Summary
 |
Goal | 1st Period 5:21 | James van Riemsdyk Goal (4) Wrist Shot, assists: David Pastrnak (7), Pavel Zacha (4) |
|
Goal | 1st Period 9:28 | Matthew Poitras Goal (4) Wrist Shot, assists: Kevin Shattenkirk (2), James van Riemsdyk (3) |
 |
Goal | 1st Period 16:20 | Lucas Raymond Goal (4) Wrist Shot, assists: David Perron (3), Dylan Larkin (12) |
|
Goal | 2nd Period 9:59 | Jake Walman Goal (3) Slap Shot, assists: Moritz Seider (10), Daniel Sprong (5) |
|
Goal | 2nd Period 13:41 | Charlie Coyle Goal (2) Wrist Shot, assists: Jake DeBrusk (4), Parker Wotherspoon (1) |
|
Goal | 3rd Period 6:50 | Dylan Larkin Goal (5) Snap Shot, assists: Lucas Raymond (6), Alex DeBrincat (5) |
|
Goal | 3rd Period 8:56 | David Perron Goal (3) Wrist Shot, assists: J.T. Compher (5), Jeff Petry (3) |
|
Goal | 3rd Period 10:34 | Andrew Copp Goal (4) Wrist Shot, assists: J.T. Compher (6), David Perron (4) |
|
Goal | 3rd Period 14:11 | David Pastrnak Goal (9) Wrist Shot, assists: Matthew Poitras (3), Hampus Lindholm (1) |
Statistics
 BOS BOS |
 DET DET |
|
|---|---|---|
| 22 | Blocked Shots | 16 |
| 22 | Hits | 25 |
| 8 | Takeaways | 6 |
| 30 | Shots | 40 |
| 1 | Power Play Goals | 2 |
| 4 | Power Play Opportunities | 8 |
| 25.0 | Power Play Percentage | 25.0 |
| 0 | Short Handed Goals | 0 |
| 0 | Shootout Goals | 0 |
| 33 | Faceoffs Won | 29 |
| 53.2 | Faceoff Win Percent | 46.8 |
| 2 | Giveaways | 5 |
| 12 | Total Penalties | 6 |
| 32 | Penalty Minutes | 20 |
 Detroit Red Wings Injuries
| NAME, POS | STATUS | DATE |
|---|---|---|
| Viktor Arvidsson, LW | Out | Jul 1 |
| Mason Appleton, C | Out | Apr 15 |
| Michael Rasmussen, C | Out | Apr 7 |
 Boston Bruins Injuries
| NAME, POS | STATUS | DATE |
|---|---|---|
| Charlie McAvoy, D | Suspension | May 12 |
| Nikita Zadorov, D | Out | May 2 |
| Dans Locmelis, C | Out | Feb 28 |
Game Information
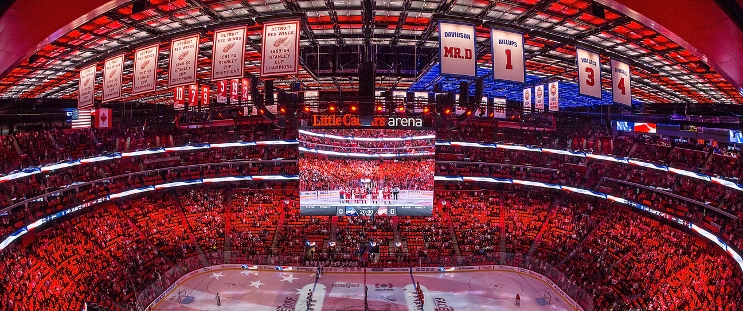 Little Caesars Arena
Location: Detroit, MI
Attendance: 18,676 | Capacity:
Little Caesars Arena
Location: Detroit, MI
Attendance: 18,676 | Capacity:
2025-26 Atlantic Division Standings
| TEAM | W | L | PTS | OTL |
|---|---|---|---|---|
| <img src="https://a.espncdn.com/i/teamlogos/nhl/500/buf.png" style="padding: 0 4px; width: 25px; vertical-align: inherit;">Buffalo | 50 | 23 | 109 | 9 |
| <img src="https://a.espncdn.com/i/teamlogos/nhl/500/tb.png" style="padding: 0 4px; width: 25px; vertical-align: inherit;">Tampa Bay | 50 | 26 | 106 | 6 |
| <img src="https://a.espncdn.com/i/teamlogos/nhl/500/mtl.png" style="padding: 0 4px; width: 25px; vertical-align: inherit;">Montreal | 48 | 24 | 106 | 10 |
| <img src="https://a.espncdn.com/i/teamlogos/nhl/500/bos.png" style="padding: 0 4px; width: 25px; vertical-align: inherit;">Boston | 45 | 27 | 100 | 10 |
| <img src="https://a.espncdn.com/i/teamlogos/nhl/500/ott.png" style="padding: 0 4px; width: 25px; vertical-align: inherit;">Ottawa | 44 | 27 | 99 | 11 |
| <img src="https://a.espncdn.com/i/teamlogos/nhl/500/det.png" style="padding: 0 4px; width: 25px; vertical-align: inherit;">Detroit | 41 | 31 | 92 | 10 |
| <img src="https://a.espncdn.com/i/teamlogos/nhl/500/fla.png" style="padding: 0 4px; width: 25px; vertical-align: inherit;">Florida | 40 | 38 | 84 | 4 |
| <img src="https://a.espncdn.com/i/teamlogos/nhl/500/tor.png" style="padding: 0 4px; width: 25px; vertical-align: inherit;">Toronto | 32 | 36 | 78 | 14 |