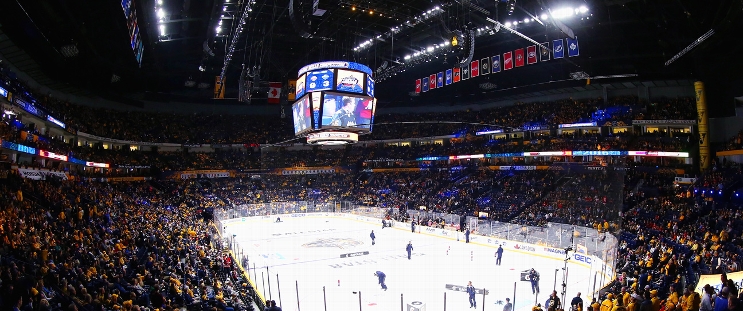
Boston Bruins at Nashville Predators
· National Hockey LeagueUllmark's 32 saves, rare assist lead Bruins over Predators 3-0

David Pastrnak and Pavel Zacha each recorded a goal and an assist in the big final period as the Bruins won for the third time in four games and extended their lead in the Atlantic Division to four points over Florida, which lost at Montreal.
“You’ve got to look at the team game we had in front of me,” Ullmark said. “We played a full 60 minutes, showed we don’t get frustrated easily.”
Juuse Saros made 30 saves for Nashville, which has lost three straight. The skid follows a franchise-record 18-game point streak (16-0-2).
“I actually thought we got better as the game went on,” Predators coach Andrew Brunette said. “I really liked our second and third period where I thought we were taking over the game. We put ourselves in a great position for somebody to make a play. Unfortunately we made a play going the wrong way.”
The shutout was the second of the season and eighth of Ullmark’s career.
Coyle broke the tie with 6:42 remaining. Ullmark stopped a Nashville dump-in behind the net and rimmed a pass up ice to Brad Marchand, who was just inside the Nashville blue line. From the left boards, he found Coyle skating through the slot and he beat Saros high to the glove side.
“Playing that puck on the PK and getting it up there around their guy to spring us, that’s huge,” Coyle said. “You don’t really expect those plays from your goalie to make those big-time plays and assist one like that, but it sure helped. He played a heck of a game even besides that.”
Boston’s tenacious penalty kill denied Nashville on all four of their power plays, limiting the Predators to three shots on goal with the man advantage.
“I thought we won a decent amount of faceoffs, and I thought our forecheck up ice, I don’t think we gave them easy entries,” Boston coach Jim Montgomery said.
Zacha doubled the Boston lead with 2:42 remaining and Pastrnak closed out the scoring with his 46th of the season.
The Predators maintain the top spot in the battle for the Western Conference’s two wild-card berths, leading the second-place Los Angeles Kings by three points and the third-place St. Louis Blues by six.
Nashville’s best opportunity to score came with 4:33 remaining in the second period when captain Roman Josi’s shot from the left circle hit the near post.
“I thought it was a good game,” Josi said. “It was fast. It felt intense, kind of like a playoff game. I felt like we went toe-to-toe. Obviously that short-handed goal was costly for us. Just looking back, our power play has got to be a lot better.”
UP NEXT
Bruins: Visit Carolina Thursday night.
Predators: Host St. Louis Thursday night.
Regular Season SeriesBOS wins series 2-0
Scoring Summary
 |
Goal | 3rd Period 13:18 | Charlie Coyle Goal (24) Wrist Shot, assists: Brad Marchand (37), Linus Ullmark (1) |
 |
Goal | 3rd Period 17:18 | Pavel Zacha Goal (19) Wrist Shot, assists: Danton Heinen (16), David Pastrnak (58) |
 |
Goal | 3rd Period 18:36 | David Pastrnak Goal (46) Wrist Shot, assists: Pavel Zacha (34), Danton Heinen (17) |
Statistics
 BOS BOS |
 NSH NSH |
|
|---|---|---|
| 20 | Blocked Shots | 9 |
| 10 | Hits | 23 |
| 9 | Takeaways | 8 |
| 32 | Shots | 31 |
| 0 | Power Play Goals | 0 |
| 2 | Power Play Opportunities | 4 |
| 0.0 | Power Play Percentage | 0.0 |
| 1 | Short Handed Goals | 0 |
| 0 | Shootout Goals | 0 |
| 18 | Faceoffs Won | 35 |
| 34.0 | Faceoff Win Percent | 66.0 |
| 10 | Giveaways | 7 |
| 4 | Total Penalties | 2 |
| 8 | Penalty Minutes | 4 |
 Nashville Predators Injuries
| NAME, POS | STATUS | DATE |
|---|
 Boston Bruins Injuries
| NAME, POS | STATUS | DATE |
|---|---|---|
| Pavel Zacha, C | Day-To-Day | Feb 7 |
Game Information
 Bridgestone Arena
Location: Nashville, TN
Attendance: 17,476 | Capacity:

Location: Nashville, TN
Attendance: 17,476 | Capacity:
2025-26 Atlantic Division Standings
| TEAM | W | L | PTS | OTL |
|---|---|---|---|---|
 Tampa Bay Tampa Bay |
37 | 14 | 78 | 4 |
 Montreal Montreal |
32 | 17 | 72 | 8 |
 Detroit Detroit |
33 | 19 | 72 | 6 |
 Buffalo Buffalo |
32 | 19 | 70 | 6 |
 Boston Boston |
32 | 20 | 69 | 5 |
 Ottawa Ottawa |
28 | 22 | 63 | 7 |
 Toronto Toronto |
27 | 21 | 63 | 9 |
 Florida Florida |
29 | 25 | 61 | 3 |
2025-26 Central Division Standings
| TEAM | W | L | PTS | OTL |
|---|---|---|---|---|
 Colorado Colorado |
37 | 9 | 83 | 9 |
 Minnesota Minnesota |
34 | 14 | 78 | 10 |
 Dallas Dallas |
34 | 14 | 77 | 9 |
 Utah Utah |
30 | 23 | 64 | 4 |
 Nashville Nashville |
26 | 24 | 59 | 7 |
 Chicago Chicago |
22 | 26 | 53 | 9 |
 Winnipeg Winnipeg |
22 | 26 | 52 | 8 |
 St. Louis St. Louis |
20 | 28 | 49 | 9 |

