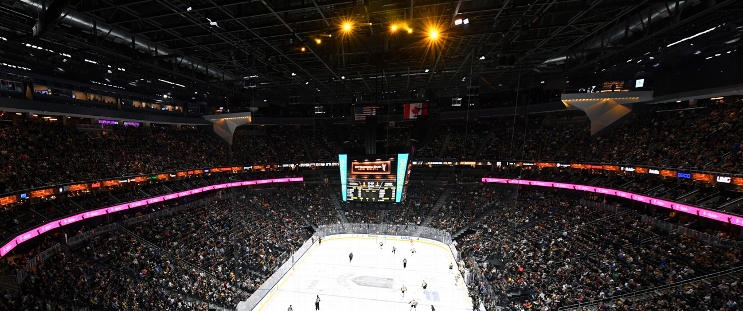
Vancouver Canucks at Vegas Golden Knights
· National Hockey League
Regular Season Series
VGK leads series 2-1
Scoring Summary
 |
Goal | 1st Period 1:37 | Anthony Mantha Goal (22) Wrist Shot, assists: none |
 |
Goal | 1st Period 6:23 | Jonathan Marchessault Goal (41) Wrist Shot, assists: Ivan Barbashev (25), Brayden McNabb (21) |
 |
Goal | 1st Period 9:20 | Nils Hoglander Goal (23) Wrist Shot, assists: Brock Boeser (32) |
 |
Goal | 1st Period 9:40 | Jack Eichel Goal (26) Snap Shot, assists: Jonathan Marchessault (24), Ivan Barbashev (26) |
 |
Goal | 1st Period 14:42 | Noah Hanifin Goal (12) Slap Shot, assists: Jack Eichel (33), Jonathan Marchessault (25) |
 |
Goal | 2nd Period 1:46 | William Karlsson Goal (26) Poke, assists: Alex Pietrangelo (29), Anthony Mantha (20) |
 |
Goal | 2nd Period 6:13 | Quinn Hughes Goal (14) Wrist Shot, assists: Conor Garland (24), J.T. Miller (60) |
 |
Goal | 3rd Period 1:41 | Quinn Hughes Goal (15) Wrist Shot, assists: Vasily Podkolzin (2) |
 |
Goal | 3rd Period 2:05 | Brett Howden Goal (8) Wrist Shot, assists: Keegan Kolesar (9), Nicolas Roy (27) |
Statistics
 VAN VAN |
 VGK VGK |
|
|---|---|---|
| 12 | Blocked Shots | 23 |
| 26 | Hits | 22 |
| 9 | Takeaways | 5 |
| 30 | Shots | 30 |
| 1 | Power Play Goals | 2 |
| 3 | Power Play Opportunities | 4 |
| 33.3 | Power Play Percentage | 50.0 |
| 0 | Short Handed Goals | 0 |
| 0 | Shootout Goals | 0 |
| 34 | Faceoffs Won | 26 |
| 56.7 | Faceoff Win Percent | 43.3 |
| 4 | Giveaways | 6 |
| 5 | Total Penalties | 3 |
| 21 | Penalty Minutes | 8 |
 Vegas Golden Knights Injuries
| NAME, POS | STATUS | DATE |
|---|---|---|
| Colton Sissons, C | Day-To-Day | Feb 6 |
| Brett Howden, C | Injured Reserve | Jan 20 |
 Vancouver Canucks Injuries
| NAME, POS | STATUS | DATE |
|---|---|---|
| Filip Chytil, C | Day-To-Day | Feb 5 |
| Nils Hoglander, LW | Day-To-Day | Feb 5 |
| Marco Rossi, C | Injured Reserve | Jan 27 |
| Zeev Buium, D | Injured Reserve | Jan 27 |
| Brock Boeser, RW | Injured Reserve | Jan 27 |
Game Information
 T-Mobile Arena
Location: Las Vegas, NV
Attendance: 18,366 | Capacity:

T-Mobile Arena
Location: Las Vegas, NV
Attendance: 18,366 | Capacity:
2025-26 Pacific Division Standings
| TEAM | W | L | PTS | OTL |
|---|---|---|---|---|
 Vegas Vegas |
27 | 16 | 68 | 14 |
 Edmonton Edmonton |
28 | 22 | 64 | 8 |
 Seattle Seattle |
27 | 20 | 63 | 9 |
 Anaheim Anaheim |
30 | 23 | 63 | 3 |
 Los Angeles Los Angeles |
23 | 19 | 60 | 14 |
 San Jose San Jose |
27 | 24 | 58 | 4 |
 Calgary Calgary |
23 | 27 | 52 | 6 |
 Vancouver Vancouver |
18 | 33 | 42 | 6 |

