
Los Angeles Kings at Florida Panthers
· National Hockey League
0 - 3

Tkachuk has goal and 2 assists, Bobrovsky stops 30 shots as Panthers beat Kings 3-0

Aleksander Barkov and Sam Bennett also scored for the Panthers, who entered the game a point back of Toronto for the top spot in the Atlantic Division. Bobrovsky got his 46th career shutout.
It was the second time in eight days the teams played each other. The Kings beat the Panthers 2-1 in Los Angeles last Wednesday.
Darcy Kuemper made 36 saves for the Kings, who have lost three straight and seven of their last 10 games. Eight of those games have been played on the road.
Panthers: Tkachuk recorded his seventh multi-assist game of the season. He's up to 31 assists on the season.
Series tied 1-1
Scoring Summary
 |
Goal | 1st Period 4:55 | Sam Bennett Goal (16) Wrist Shot, assists: Matthew Tkachuk (30), Dmitry Kulikov (8) |
|
Goal | 3rd Period 4:43 | Aleksander Barkov Goal (12) Backhand, assists: Matthew Tkachuk (31), Sam Reinhart (25) |
|
Goal | 3rd Period 18:48 | Matthew Tkachuk Goal (16) Wrist Shot, assists: Eetu Luostarinen (11), Aaron Ekblad (20) |
Statistics
 LA LA |
 FLA FLA |
|
|---|---|---|
| 10 | Blocked Shots | 21 |
| 18 | Hits | 23 |
| 2 | Takeaways | 1 |
| 29 | Shots | 39 |
| 0 | Power Play Goals | 1 |
| 2 | Power Play Opportunities | 4 |
| 0.0 | Power Play Percentage | 25.0 |
| 0 | Short Handed Goals | 0 |
| 0 | Shootout Goals | 0 |
| 34 | Faceoffs Won | 26 |
| 56.7 | Faceoff Win Percent | 43.3 |
| 11 | Giveaways | 14 |
| 5 | Total Penalties | 3 |
| 10 | Penalty Minutes | 6 |
 Florida Panthers Injuries
| NAME, POS | STATUS | DATE |
|---|---|---|
| Carter Verhaeghe, C | Out | Apr 15 |
| Sam Bennett, C | Out | Apr 15 |
| Gustav Forsling, D | Out | Apr 15 |
| Tomas Nosek, LW | Out | Apr 15 |
| Seth Jones, D | Out | Apr 9 |
 Los Angeles Kings Injuries
| NAME, POS | STATUS | DATE |
|---|---|---|
| Kevin Fiala, LW | Injured Reserve | Mar 6 |
Game Information
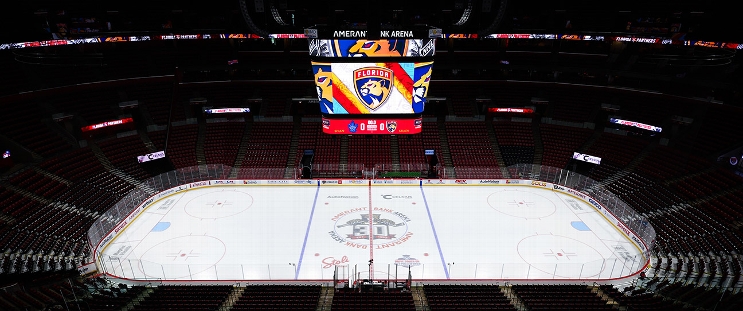 Amerant Bank Arena
Location: Sunrise, FL
Attendance: 19,515 | Capacity:
Location: Sunrise, FL
Attendance: 19,515 | Capacity:
2025-26 Pacific Division Standings
| TEAM | W | L | PTS | OTL |
|---|---|---|---|---|
| <img src="https://a.espncdn.com/i/teamlogos/nhl/500/vgk.png" style="padding: 0 4px; width: 25px; vertical-align: inherit;">Vegas | 39 | 26 | 95 | 17 |
| <img src="https://a.espncdn.com/i/teamlogos/nhl/500/edm.png" style="padding: 0 4px; width: 25px; vertical-align: inherit;">Edmonton | 41 | 30 | 93 | 11 |
| <img src="https://a.espncdn.com/i/teamlogos/nhl/500/ana.png" style="padding: 0 4px; width: 25px; vertical-align: inherit;">Anaheim | 43 | 33 | 92 | 6 |
| <img src="https://a.espncdn.com/i/teamlogos/nhl/500/la.png" style="padding: 0 4px; width: 25px; vertical-align: inherit;">Los Angeles | 35 | 27 | 90 | 20 |
| <img src="https://a.espncdn.com/i/teamlogos/nhl/500/sj.png" style="padding: 0 4px; width: 25px; vertical-align: inherit;">San Jose | 39 | 35 | 86 | 8 |
| <img src="https://a.espncdn.com/i/teamlogos/nhl/500/sea.png" style="padding: 0 4px; width: 25px; vertical-align: inherit;">Seattle | 34 | 37 | 79 | 11 |
| <img src="https://a.espncdn.com/i/teamlogos/nhl/500/cgy.png" style="padding: 0 4px; width: 25px; vertical-align: inherit;">Calgary | 34 | 39 | 77 | 9 |
| <img src="https://a.espncdn.com/i/teamlogos/nhl/500/van.png" style="padding: 0 4px; width: 25px; vertical-align: inherit;">Vancouver | 25 | 49 | 58 | 8 |
2025-26 Atlantic Division Standings
| TEAM | W | L | PTS | OTL |
|---|---|---|---|---|
| <img src="https://a.espncdn.com/i/teamlogos/nhl/500/buf.png" style="padding: 0 4px; width: 25px; vertical-align: inherit;">Buffalo | 50 | 23 | 109 | 9 |
| <img src="https://a.espncdn.com/i/teamlogos/nhl/500/tb.png" style="padding: 0 4px; width: 25px; vertical-align: inherit;">Tampa Bay | 50 | 26 | 106 | 6 |
| <img src="https://a.espncdn.com/i/teamlogos/nhl/500/mtl.png" style="padding: 0 4px; width: 25px; vertical-align: inherit;">Montreal | 48 | 24 | 106 | 10 |
| <img src="https://a.espncdn.com/i/teamlogos/nhl/500/bos.png" style="padding: 0 4px; width: 25px; vertical-align: inherit;">Boston | 45 | 27 | 100 | 10 |
| <img src="https://a.espncdn.com/i/teamlogos/nhl/500/ott.png" style="padding: 0 4px; width: 25px; vertical-align: inherit;">Ottawa | 44 | 27 | 99 | 11 |
| <img src="https://a.espncdn.com/i/teamlogos/nhl/500/det.png" style="padding: 0 4px; width: 25px; vertical-align: inherit;">Detroit | 41 | 31 | 92 | 10 |
| <img src="https://a.espncdn.com/i/teamlogos/nhl/500/fla.png" style="padding: 0 4px; width: 25px; vertical-align: inherit;">Florida | 40 | 38 | 84 | 4 |
| <img src="https://a.espncdn.com/i/teamlogos/nhl/500/tor.png" style="padding: 0 4px; width: 25px; vertical-align: inherit;">Toronto | 32 | 36 | 78 | 14 |