
Pittsburgh Penguins at San Jose Sharks
· National Hockey LeagueCrosby and Malkin each have goal and assist, Jarry stops 31 shots as Penguins beat Sharks 3-0
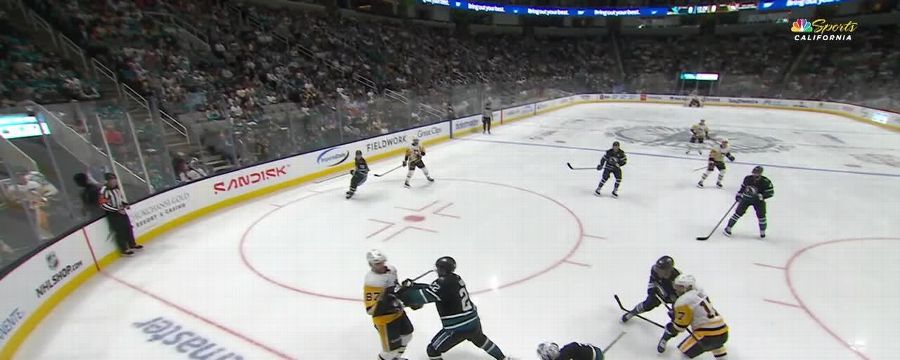
Anthony Mantha also scored for the Penguins, who improved to 4-2-0 on the season.
Alex Nedeljkovic made 24 saves for the Sharks, and San Jose outshot an opponent for the first time this season but was unable to score. The Sharks, an NHL-worst 20-50-12 last season, remained the league's only winless team at 0-3-2.
San Jose has now started four straight seasons winless through five games.
Crosby opened the scoring 7:35 into the second period on a deflection off of a point shot by Kris Letang.
Mantha padded the Penguins’ lead 7:02 into the second period, and Malkin capped the scoring on an empty-netter with 22 seconds remaining.
Jarry lowered his goals-against average to 2.35 on the season.
Sharks: At New York Islanders on Tuesday to open a four-game trip.
Regular Season SeriesPIT leads series 1-0
Scoring Summary
 |
Goal | 2nd Period 7:35 | Sidney Crosby Goal (3) Tip-In, assists: Kris Letang (1), Rickard Rakell (3) |
 |
Goal | 3rd Period 7:02 | Anthony Mantha Goal (2) Wrist Shot, assists: Justin Brazeau (1), Evgeni Malkin (7) |
 |
Goal | 3rd Period 19:38 | Evgeni Malkin Goal (2) Wrist Shot, assists: Sidney Crosby (4), Erik Karlsson (3) |
Statistics
 PIT PIT |
 SJ SJ |
|
|---|---|---|
| 21 | Blocked Shots | 14 |
| 11 | Hits | 25 |
| 4 | Takeaways | 5 |
| 27 | Shots | 31 |
| 0 | Power Play Goals | 0 |
| 1 | Power Play Opportunities | 2 |
| 0.0 | Power Play Percentage | 0.0 |
| 0 | Short Handed Goals | 0 |
| 0 | Shootout Goals | 0 |
| 18 | Faceoffs Won | 22 |
| 45.0 | Faceoff Win Percent | 55.0 |
| 20 | Giveaways | 16 |
| 2 | Total Penalties | 1 |
| 4 | Penalty Minutes | 2 |
 San Jose Sharks Injuries
| NAME, POS | STATUS | DATE |
|---|---|---|
| Jeff Skinner, LW | Day-To-Day | Nov 13 |
| Michael Misa, C | Injured Reserve | Nov 7 |
| Logan Couture, C | Injured Reserve | Sep 30 |
 Pittsburgh Penguins Injuries
| NAME, POS | STATUS | DATE |
|---|---|---|
| Filip Hallander, C | Injured Reserve | Nov 8 |
| Noel Acciari, C | Injured Reserve | Nov 5 |
| Justin Brazeau, RW | Injured Reserve | Nov 5 |
| Tristan Jarry, G | Injured Reserve | Nov 5 |
| Rickard Rakell, RW | Injured Reserve | Oct 27 |
Game Information
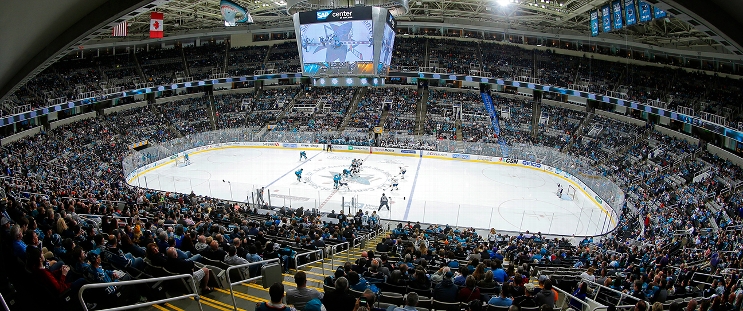 SAP Center at San Jose
Location: San Jose, CA
Attendance: 17,435 | Capacity:

Location: San Jose, CA
Attendance: 17,435 | Capacity:
2025-26 Metropolitan Division Standings
| TEAM | W | L | PTS | OTL |
|---|---|---|---|---|
 New Jersey New Jersey |
12 | 4 | 25 | 1 |
 Carolina Carolina |
12 | 5 | 24 | 0 |
 Pittsburgh Pittsburgh |
9 | 5 | 22 | 4 |
 NY Islanders NY Islanders |
10 | 6 | 22 | 2 |
 Philadelphia Philadelphia |
9 | 5 | 21 | 3 |
 NY Rangers NY Rangers |
9 | 7 | 20 | 2 |
 Columbus Columbus |
9 | 7 | 19 | 1 |
 Washington Washington |
8 | 8 | 17 | 1 |
2025-26 Pacific Division Standings
| TEAM | W | L | PTS | OTL |
|---|---|---|---|---|
 Anaheim Anaheim |
11 | 5 | 23 | 1 |
 Los Angeles Los Angeles |
9 | 5 | 22 | 4 |
 Seattle Seattle |
8 | 4 | 21 | 5 |
 Edmonton Edmonton |
8 | 7 | 20 | 4 |
 Vegas Vegas |
7 | 4 | 19 | 5 |
 San Jose San Jose |
8 | 7 | 19 | 3 |
 Vancouver Vancouver |
8 | 9 | 18 | 2 |
 Calgary Calgary |
5 | 12 | 12 | 2 |

