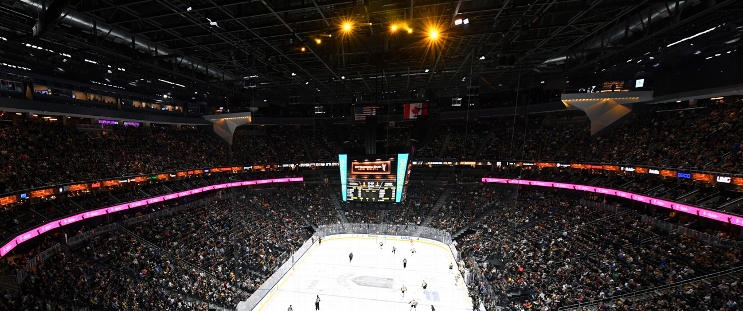
Tampa Bay Lightning at Vegas Golden Knights
· National Hockey LeagueKucherov scores twice in third period as Lightning beat Golden Knights 6-3

Brandon Hagel also had two goals and an assist for the Lightning, while Gage Goncalves and Dominic James added goals. Andrei Vasilevskiy made 29 saves. James and Oliver Bjorkstrand also had a pair of assists each.
Ivan Barbashev had two goals and an assist for Vegas while Mitch Marner had a goal and two assists. Carl Lindbom stopped 21 shots for the Golden Knights.
The game was tied 2-2 after two periods but Kucherov scored his first 2:48 into the third to give the Lightning a 3-2 lead.
Marner tied it at 3-all less than a minute later but Hagel's goal 35 seconds after that gave Tampa Bay the lead for good. Kucherov got his second on the power play with 5:47 to play to make it 5-3 and Hagel scored into an empty net with less than a minute to play.
Barbashev scored two goals in the first to give Vegas a 2-0 lead after one, but Goncalves and James scored in the second to make 2-2 after two.
The Golden Knights went scoreless on the power play in three chances.
Golden Knights: Home against Anaheim on Saturday night.
Regular Season SeriesTB wins series 2-0
Scoring Summary
 |
Goal | 1st Period 7:25 | Ivan Barbashev Goal (5) Backhand, assists: Noah Hanifin (1), Mitch Marner (12) |
 |
Goal | 1st Period 15:53 | Ivan Barbashev Goal (6) Snap Shot, assists: Mitch Marner (13), Jack Eichel (12) |
 |
Goal | 2nd Period 0:36 | Gage Goncalves Goal (1) Wrist Shot, assists: Dominic James (1) |
 |
Goal | 2nd Period 3:28 | Dominic James Goal (1) Wrist Shot, assists: Oliver Bjorkstrand (3), J.J. Moser (2) |
 |
Goal | 3rd Period 2:47 | Nikita Kucherov Goal (6) Wrist Shot, assists: Oliver Bjorkstrand (4), Jake Guentzel (8) |
 |
Goal | 3rd Period 3:37 | Mitch Marner Goal (4) Wrist Shot, assists: Jack Eichel (13), Ivan Barbashev (8) |
 |
Goal | 3rd Period 4:12 | Brandon Hagel Goal (5) Wrist Shot, assists: Dominic James (2) |
 |
Goal | 3rd Period 14:13 | Nikita Kucherov Goal (7) Slap Shot, assists: Victor Hedman (11), Brandon Hagel (6) |
 |
Goal | 3rd Period 19:13 | Brandon Hagel Goal (6) Wrist Shot, assists: Nikita Kucherov (7) |
Statistics
 TB TB |
 VGK VGK |
|
|---|---|---|
| 16 | Blocked Shots | 17 |
| 11 | Hits | 13 |
| 9 | Takeaways | 2 |
| 27 | Shots | 32 |
| 2 | Power Play Goals | 0 |
| 4 | Power Play Opportunities | 3 |
| 50.0 | Power Play Percentage | 0.0 |
| 0 | Short Handed Goals | 0 |
| 0 | Shootout Goals | 0 |
| 22 | Faceoffs Won | 32 |
| 40.7 | Faceoff Win Percent | 59.3 |
| 8 | Giveaways | 13 |
| 2 | Total Penalties | 4 |
| 6 | Penalty Minutes | 8 |
 Vegas Golden Knights Injuries
| NAME, POS | STATUS | DATE |
|---|---|---|
| Colton Sissons, C | Day-To-Day | Feb 6 |
| Brett Howden, C | Injured Reserve | Jan 20 |
 Tampa Bay Lightning Injuries
| NAME, POS | STATUS | DATE |
|---|---|---|
| Victor Hedman, D | Day-To-Day | Feb 18 |
| Nick Paul, LW | Day-To-Day | Feb 6 |
| Anthony Cirelli, C | Day-To-Day | Feb 6 |
| Brayden Point, C | Injured Reserve | Feb 5 |
| Charle-Edouard D'Astous, D | Injured Reserve | Jan 25 |
Game Information
 T-Mobile Arena
Location: Las Vegas, NV
Attendance: 17,717 | Capacity:

Location: Las Vegas, NV
Attendance: 17,717 | Capacity:
2025-26 Atlantic Division Standings
| TEAM | W | L | PTS | OTL |
|---|---|---|---|---|
 Tampa Bay Tampa Bay |
37 | 14 | 78 | 4 |
 Montreal Montreal |
32 | 17 | 72 | 8 |
 Detroit Detroit |
33 | 19 | 72 | 6 |
 Buffalo Buffalo |
32 | 19 | 70 | 6 |
 Boston Boston |
32 | 20 | 69 | 5 |
 Ottawa Ottawa |
28 | 22 | 63 | 7 |
 Toronto Toronto |
27 | 21 | 63 | 9 |
 Florida Florida |
29 | 25 | 61 | 3 |
2025-26 Pacific Division Standings
| TEAM | W | L | PTS | OTL |
|---|---|---|---|---|
 Vegas Vegas |
27 | 16 | 68 | 14 |
 Edmonton Edmonton |
28 | 22 | 64 | 8 |
 Seattle Seattle |
27 | 20 | 63 | 9 |
 Anaheim Anaheim |
30 | 23 | 63 | 3 |
 Los Angeles Los Angeles |
23 | 19 | 60 | 14 |
 San Jose San Jose |
27 | 24 | 58 | 4 |
 Calgary Calgary |
23 | 27 | 52 | 6 |
 Vancouver Vancouver |
18 | 33 | 42 | 6 |

