
Los Angeles Kings at Pittsburgh Penguins
· National Hockey LeagueFiala breaks tie with 500th NHL point, Kings open 6-game trip with 3-2 win over Penguins

Fiala got around defenseman Erik Karlsson and shot over goalie Sergei Murashov. Fiala also had an assist. The 29-year-old Swiss winger has 218 goals and 282 assists in 667 regular-season games with Nashville, Minnesota and Los Angeles.
Corey Perry tied it at 2 for the Kings at 4:49 of the third. He also had an assist.
Anze Kopitar also scored for Los Angeles, and Darcy Kuemper stopped 31 shots. The Kings improved to 7-5-4. They had lost three of four.
Tommy Novak and Anthony Mantha scored for Pittsburgh, coming off a 2-1 shootout loss at New Jersey on Saturday. The Penguins have lost four of five to fall to 9-5-3. They now head to Sweden for a pair of games against Nashville.
Murashov made 24 saves in his NHL debut.
Penguins: Face Nashville in Stockholm on Friday and Sunday in NHL Global Series games.
Regular Season SeriesSeries tied 1-1
Scoring Summary
 |
Goal | 1st Period 8:48 | Thomas Novak Goal (2) Wrist Shot, assists: Evgeni Malkin (18), Parker Wotherspoon (5) |
 |
Goal | 1st Period 14:58 | Anze Kopitar Goal (2) Wrist Shot, assists: Kevin Fiala (5), Corey Perry (4) |
 |
Goal | 2nd Period 7:48 | Anthony Mantha Goal (8) Wrist Shot, assists: Kris Letang (7), Ville Koivunen (2) |
 |
Goal | 3rd Period 4:49 | Corey Perry Goal (7) Wrist Shot, assists: Cody Ceci (3), Trevor Moore (2) |
 |
Goal | 3rd Period 11:52 | Kevin Fiala Goal (7) Wrist Shot, assists: Drew Doughty (4), Alex Laferriere (4) |
Statistics
 LA LA |
 PIT PIT |
|
|---|---|---|
| 7 | Blocked Shots | 17 |
| 9 | Hits | 19 |
| 3 | Takeaways | 2 |
| 27 | Shots | 33 |
| 1 | Power Play Goals | 1 |
| 4 | Power Play Opportunities | 2 |
| 25.0 | Power Play Percentage | 50.0 |
| 0 | Short Handed Goals | 0 |
| 0 | Shootout Goals | 0 |
| 27 | Faceoffs Won | 27 |
| 50.0 | Faceoff Win Percent | 50.0 |
| 15 | Giveaways | 16 |
| 2 | Total Penalties | 4 |
| 4 | Penalty Minutes | 8 |
 Pittsburgh Penguins Injuries
| NAME, POS | STATUS | DATE |
|---|---|---|
| Sidney Crosby, C | Day-To-Day | Feb 21 |
| Filip Hallander, C | Injured Reserve | Feb 18 |
| Kris Letang, D | Injured Reserve | Feb 17 |
| Noel Acciari, C | Day-To-Day | Feb 6 |
| Blake Lizotte, C | Day-To-Day | Feb 6 |
 Los Angeles Kings Injuries
| NAME, POS | STATUS | DATE |
|---|---|---|
| Mikey Anderson, D | Injured Reserve | Feb 18 |
| Kevin Fiala, LW | Injured Reserve | Feb 18 |
| Artemi Panarin, LW | Day-To-Day | Feb 6 |
| Andrei Kuzmenko, LW | Day-To-Day | Feb 5 |
| Alex Turcotte, C | Injured Reserve | Jan 31 |
Game Information
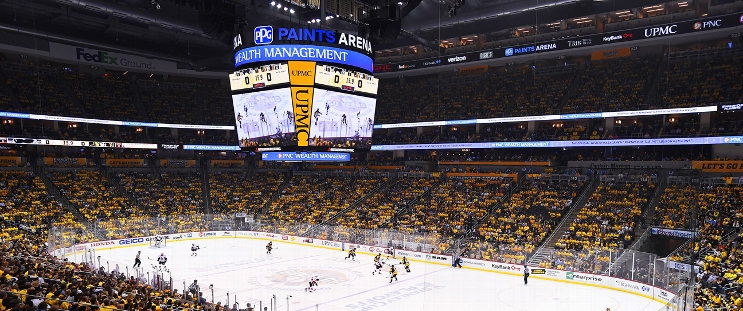 PPG Paints Arena
Location: Pittsburgh, PA
Attendance: 18,343 | Capacity:

Location: Pittsburgh, PA
Attendance: 18,343 | Capacity:
2025-26 Pacific Division Standings
| TEAM | W | L | PTS | OTL |
|---|---|---|---|---|
 Vegas Vegas |
27 | 16 | 68 | 14 |
 Edmonton Edmonton |
28 | 22 | 64 | 8 |
 Seattle Seattle |
27 | 20 | 63 | 9 |
 Anaheim Anaheim |
30 | 23 | 63 | 3 |
 Los Angeles Los Angeles |
23 | 19 | 60 | 14 |
 San Jose San Jose |
27 | 24 | 58 | 4 |
 Calgary Calgary |
23 | 27 | 52 | 6 |
 Vancouver Vancouver |
18 | 33 | 42 | 6 |
2025-26 Metropolitan Division Standings
| TEAM | W | L | PTS | OTL |
|---|---|---|---|---|
 Carolina Carolina |
36 | 15 | 78 | 6 |
 Pittsburgh Pittsburgh |
29 | 15 | 70 | 12 |
 NY Islanders NY Islanders |
32 | 21 | 69 | 5 |
 Columbus Columbus |
29 | 20 | 65 | 7 |
 Washington Washington |
29 | 23 | 65 | 7 |
 Philadelphia Philadelphia |
25 | 20 | 61 | 11 |
 New Jersey New Jersey |
28 | 27 | 58 | 2 |
 NY Rangers NY Rangers |
22 | 29 | 50 | 6 |

