
Philadelphia Flyers at Dallas Stars
· National Hockey League
1 - 5

Robertson's natural hat trick leads Stars past Flyers 5-1

Robertson scored twice in the second period and on a third-period power play, giving him three straight three-point games. It was his sixth career hat trick, with one coming in the Stanley Cup playoffs.
Tyler Seguin had a goal and an assist and Lian Bichsel also scored for Dallas, which won 7-0 at Montreal on Thursday. Jake Oettinger made 20 saves.
Roope Hintz assisted on all three of Robertson’s goals.
Christian Dvorak ended Oettinger’s bid to become the first NHL goalie with two shutouts this season, lifting in a backhand with 9:03 to play. Dan Vladar stopped 23 shots for the Flyers, who split a road back-to-back after winning 6-5 in a shootout at St. Louis on Friday night.
The Stars’ winning streak is their longest since a seven-game run from March 22 to April 3 last season.
Dallas has nine straight home wins over Philadelphia and has won 10 of its last 11 games against the Flyers overall.
Bichsel’s opening goal at 3:48 of the first period came during an early Dallas offensive. The Stars outshot the Flyers 7-1 during the first 15 minutes and 8-2 in the period with Philadelphia blocking seven shots.
Stars defenseman Thomas Harley, who missed only seven games the past two seasons, sat out his first game this season and is week-to-week with a lower-body injury.
Stars: Host the New York Islanders on Tuesday.
Regular Season SeriesDAL leads series 1-0
Scoring Summary
 |
Goal | 1st Period 3:48 | Lian Bichsel Goal (1) Wrist Shot, assists: Alexander Petrovic (4), Justin Hryckowian (2) |
|
Goal | 2nd Period 11:39 | Jason Robertson Goal (7) Backhand, assists: Tyler Seguin (3), Roope Hintz (10) |
|
Goal | 2nd Period 17:02 | Jason Robertson Goal (8) Wrist Shot, assists: Roope Hintz (11), Esa Lindell (4) |
|
Goal | 3rd Period 9:29 | Jason Robertson Goal (9) Wrist Shot, assists: Roope Hintz (12), Mikko Rantanen (17) |
 |
Goal | 3rd Period 10:57 | Christian Dvorak Goal (6) Backhand, assists: Owen Tippett (5), Jamie Drysdale (6) |
|
Goal | 3rd Period 13:51 | Tyler Seguin Goal (7) Wrist Shot, assists: Ilya Lyubushkin (4) |
Statistics
 PHI PHI |
 DAL DAL |
|
|---|---|---|
| 12 | Blocked Shots | 12 |
| 32 | Hits | 23 |
| 6 | Takeaways | 3 |
| 21 | Shots | 28 |
| 0 | Power Play Goals | 1 |
| 1 | Power Play Opportunities | 2 |
| 0.0 | Power Play Percentage | 50.0 |
| 0 | Short Handed Goals | 0 |
| 0 | Shootout Goals | 0 |
| 28 | Faceoffs Won | 24 |
| 53.8 | Faceoff Win Percent | 46.2 |
| 17 | Giveaways | 11 |
| 2 | Total Penalties | 1 |
| 4 | Penalty Minutes | 2 |
 Dallas Stars Injuries
| NAME, POS | STATUS | DATE |
|---|---|---|
| Arttu Hyry, RW | Out | Jul 1 |
| Roope Hintz, C | Out | May 4 |
| Tyler Seguin, C | Injured Reserve | May 4 |
| Nils Lundkvist, D | Out | Apr 29 |
 Philadelphia Flyers Injuries
| NAME, POS | STATUS | DATE |
|---|---|---|
| Nikita Grebenkin, RW | Out | May 14 |
| Noah Cates, LW | Out | May 12 |
| Owen Tippett, RW | Out | May 11 |
| Ty Murchison, D | Out | Feb 3 |
Game Information
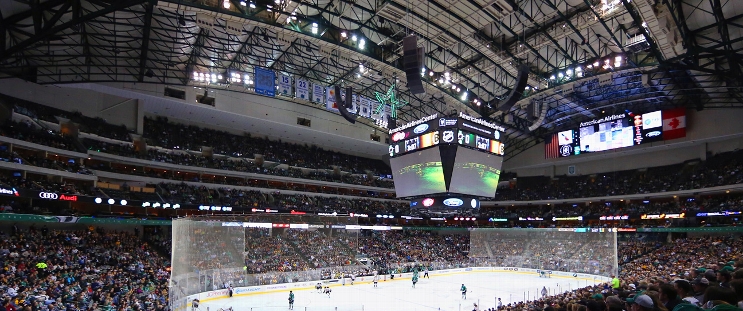 American Airlines Center
Location: Dallas, TX
Attendance: 18,532 | Capacity:
Location: Dallas, TX
Attendance: 18,532 | Capacity:
2025-26 Metropolitan Division Standings
| TEAM | W | L | PTS | OTL |
|---|---|---|---|---|
| <img src="https://a.espncdn.com/i/teamlogos/nhl/500/car.png" style="padding: 0 4px; width: 25px; vertical-align: inherit;">Carolina | 53 | 22 | 113 | 7 |
| <img src="https://a.espncdn.com/i/teamlogos/nhl/500/pit.png" style="padding: 0 4px; width: 25px; vertical-align: inherit;">Pittsburgh | 41 | 25 | 98 | 16 |
| <img src="https://a.espncdn.com/i/teamlogos/nhl/500/phi.png" style="padding: 0 4px; width: 25px; vertical-align: inherit;">Philadelphia | 43 | 27 | 98 | 12 |
| <img src="https://a.espncdn.com/i/teamlogos/nhl/500/wsh.png" style="padding: 0 4px; width: 25px; vertical-align: inherit;">Washington | 43 | 30 | 95 | 9 |
| <img src="https://a.espncdn.com/i/teamlogos/nhl/500/cbj.png" style="padding: 0 4px; width: 25px; vertical-align: inherit;">Columbus | 40 | 30 | 92 | 12 |
| <img src="https://a.espncdn.com/i/teamlogos/nhl/500/nyi.png" style="padding: 0 4px; width: 25px; vertical-align: inherit;">NY Islanders | 43 | 34 | 91 | 5 |
| <img src="https://a.espncdn.com/i/teamlogos/nhl/500/nj.png" style="padding: 0 4px; width: 25px; vertical-align: inherit;">New Jersey | 42 | 37 | 87 | 3 |
| <img src="https://a.espncdn.com/i/teamlogos/nhl/500/nyr.png" style="padding: 0 4px; width: 25px; vertical-align: inherit;">NY Rangers | 34 | 39 | 77 | 9 |
2025-26 Central Division Standings
| TEAM | W | L | PTS | OTL |
|---|---|---|---|---|
| <img src="https://a.espncdn.com/i/teamlogos/nhl/500/col.png" style="padding: 0 4px; width: 25px; vertical-align: inherit;">Colorado | 55 | 16 | 121 | 11 |
| <img src="https://a.espncdn.com/i/teamlogos/nhl/500/dal.png" style="padding: 0 4px; width: 25px; vertical-align: inherit;">Dallas | 50 | 20 | 112 | 12 |
| <img src="https://a.espncdn.com/i/teamlogos/nhl/500/min.png" style="padding: 0 4px; width: 25px; vertical-align: inherit;">Minnesota | 46 | 24 | 104 | 12 |
| <img src="https://a.espncdn.com/i/teamlogos/nhl/500/uta.png" style="padding: 0 4px; width: 25px; vertical-align: inherit;">Utah | 43 | 33 | 92 | 6 |
| <img src="https://a.espncdn.com/i/teamlogos/nhl/500/stl.png" style="padding: 0 4px; width: 25px; vertical-align: inherit;">St. Louis | 37 | 33 | 86 | 12 |
| <img src="https://a.espncdn.com/i/teamlogos/nhl/500/nsh.png" style="padding: 0 4px; width: 25px; vertical-align: inherit;">Nashville | 38 | 34 | 86 | 10 |
| <img src="https://a.espncdn.com/i/teamlogos/nhl/500/wpg.png" style="padding: 0 4px; width: 25px; vertical-align: inherit;">Winnipeg | 35 | 35 | 82 | 12 |
| <img src="https://a.espncdn.com/i/teamlogos/nhl/500/chi.png" style="padding: 0 4px; width: 25px; vertical-align: inherit;">Chicago | 29 | 39 | 72 | 14 |