
Seattle Kraken at Detroit Red Wings
· National Hockey League
2 - 4

Red Wings rookie Nate Danielson has goal and assist for first NHL points in 4-2 win over Kraken

Lucas Raymond and Emmitt Finnie scored in a three-goal second period and Dylan Larkin added an empty-netter as the Red Wings began a four-game homestand. Danielson, Finnie and defenseman Axel Sandin-Pellikka, all rookies this season, combined for four points in the second period.
Danielson, the ninth overall pick in the 2023 draft, gave the Red Wings a 2-1 lead just 45 seconds after Raymond scored. Sandin-Pellikka's point shot deflected off Mason Appleton's stick and Danielson's shin pad before slipping past goalie Joey Daccord.
The 21-year-old Danielson, who played in his fifth career game, had a second goal later that period erased by an offside call on Finnie after a replay challenge by the Kraken. He fed Finnie with a slick pass into the slot for the go-ahead goal on a power play midway through the second.
Larkin's empty-netter gave him 600 career points, a goal set up by Raymond to give him his fourth straight multipoint game. The fifth-year standout has two goals and eight assists in his last five games.
Jordan Eberle scored on a power play with 58 seconds left in the first period and Ryker Evans tied the game at 2 in the second for the Kraken, who started a four-game road trip. Eberle became the fourth player to reach the 300-game mark with the Kraken, who joined the league as an expansion club four years ago.
Daccord returned to the net for the Kraken with 24 saves, after missing the previous five games with an upper-body injury.
DET leads series 1-0
Scoring Summary
 |
Goal | 1st Period 19:02 | Jordan Eberle Goal (8) Wrist Shot, assists: Matty Beniers (11), Eeli Tolvanen (7) |
 |
Goal | 2nd Period 1:19 | Lucas Raymond Goal (6) Snap Shot, assists: Alex DeBrincat (13), Moritz Seider (10) |
|
Goal | 2nd Period 2:04 | Nate Danielson Goal (1) Deflected, assists: Mason Appleton (5), Axel Sandin-Pellikka (4) |
|
Goal | 2nd Period 7:26 | Ryker Evans Goal (2) Wrist Shot, assists: Eeli Tolvanen (8), Shane Wright (5) |
|
Goal | 2nd Period 10:56 | Emmitt Finnie Goal (5) Snap Shot, assists: Nate Danielson (1), Andrew Copp (7) |
|
Goal | 3rd Period 19:30 | Dylan Larkin Goal (12) Wrist Shot, assists: Lucas Raymond (16), Alex DeBrincat (14) |
Statistics
 SEA SEA |
 DET DET |
|
|---|---|---|
| 14 | Blocked Shots | 9 |
| 11 | Hits | 23 |
| 3 | Takeaways | 4 |
| 22 | Shots | 27 |
| 1 | Power Play Goals | 1 |
| 2 | Power Play Opportunities | 2 |
| 50.0 | Power Play Percentage | 50.0 |
| 0 | Short Handed Goals | 0 |
| 0 | Shootout Goals | 0 |
| 31 | Faceoffs Won | 32 |
| 49.2 | Faceoff Win Percent | 50.8 |
| 14 | Giveaways | 13 |
| 2 | Total Penalties | 2 |
| 4 | Penalty Minutes | 4 |
 Detroit Red Wings Injuries
| NAME, POS | STATUS | DATE |
|---|---|---|
| Viktor Arvidsson, LW | Out | Jul 1 |
| Mason Appleton, C | Out | Apr 15 |
| Michael Rasmussen, C | Out | Apr 7 |
 Seattle Kraken Injuries
| NAME, POS | STATUS | DATE |
|---|---|---|
| Jared McCann, LW | Out | Apr 17 |
| Joey Daccord, G | Out | Apr 16 |
Game Information
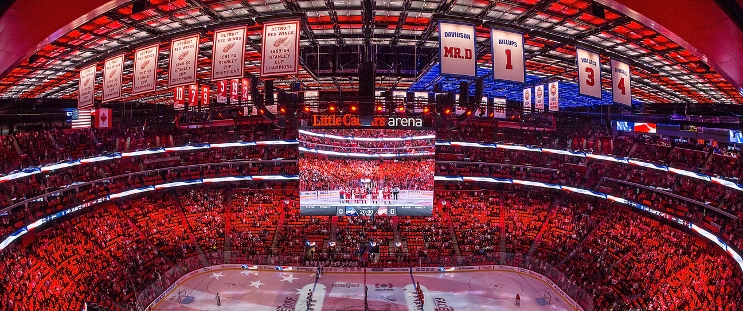 Little Caesars Arena
Location: Detroit, MI
Attendance: 19,515 | Capacity:
Location: Detroit, MI
Attendance: 19,515 | Capacity:
2025-26 Pacific Division Standings
| TEAM | W | L | PTS | OTL |
|---|---|---|---|---|
| <img src="https://a.espncdn.com/i/teamlogos/nhl/500/vgk.png" style="padding: 0 4px; width: 25px; vertical-align: inherit;">Vegas | 39 | 26 | 95 | 17 |
| <img src="https://a.espncdn.com/i/teamlogos/nhl/500/edm.png" style="padding: 0 4px; width: 25px; vertical-align: inherit;">Edmonton | 41 | 30 | 93 | 11 |
| <img src="https://a.espncdn.com/i/teamlogos/nhl/500/ana.png" style="padding: 0 4px; width: 25px; vertical-align: inherit;">Anaheim | 43 | 33 | 92 | 6 |
| <img src="https://a.espncdn.com/i/teamlogos/nhl/500/la.png" style="padding: 0 4px; width: 25px; vertical-align: inherit;">Los Angeles | 35 | 27 | 90 | 20 |
| <img src="https://a.espncdn.com/i/teamlogos/nhl/500/sj.png" style="padding: 0 4px; width: 25px; vertical-align: inherit;">San Jose | 39 | 35 | 86 | 8 |
| <img src="https://a.espncdn.com/i/teamlogos/nhl/500/sea.png" style="padding: 0 4px; width: 25px; vertical-align: inherit;">Seattle | 34 | 37 | 79 | 11 |
| <img src="https://a.espncdn.com/i/teamlogos/nhl/500/cgy.png" style="padding: 0 4px; width: 25px; vertical-align: inherit;">Calgary | 34 | 39 | 77 | 9 |
| <img src="https://a.espncdn.com/i/teamlogos/nhl/500/van.png" style="padding: 0 4px; width: 25px; vertical-align: inherit;">Vancouver | 25 | 49 | 58 | 8 |
2025-26 Atlantic Division Standings
| TEAM | W | L | PTS | OTL |
|---|---|---|---|---|
| <img src="https://a.espncdn.com/i/teamlogos/nhl/500/buf.png" style="padding: 0 4px; width: 25px; vertical-align: inherit;">Buffalo | 50 | 23 | 109 | 9 |
| <img src="https://a.espncdn.com/i/teamlogos/nhl/500/tb.png" style="padding: 0 4px; width: 25px; vertical-align: inherit;">Tampa Bay | 50 | 26 | 106 | 6 |
| <img src="https://a.espncdn.com/i/teamlogos/nhl/500/mtl.png" style="padding: 0 4px; width: 25px; vertical-align: inherit;">Montreal | 48 | 24 | 106 | 10 |
| <img src="https://a.espncdn.com/i/teamlogos/nhl/500/bos.png" style="padding: 0 4px; width: 25px; vertical-align: inherit;">Boston | 45 | 27 | 100 | 10 |
| <img src="https://a.espncdn.com/i/teamlogos/nhl/500/ott.png" style="padding: 0 4px; width: 25px; vertical-align: inherit;">Ottawa | 44 | 27 | 99 | 11 |
| <img src="https://a.espncdn.com/i/teamlogos/nhl/500/det.png" style="padding: 0 4px; width: 25px; vertical-align: inherit;">Detroit | 41 | 31 | 92 | 10 |
| <img src="https://a.espncdn.com/i/teamlogos/nhl/500/fla.png" style="padding: 0 4px; width: 25px; vertical-align: inherit;">Florida | 40 | 38 | 84 | 4 |
| <img src="https://a.espncdn.com/i/teamlogos/nhl/500/tor.png" style="padding: 0 4px; width: 25px; vertical-align: inherit;">Toronto | 32 | 36 | 78 | 14 |