
New York Islanders at Detroit Red Wings
· National Hockey League
5 - 0

Shabanov has 2 goals and an assist, Sorokin stops 29 shots as Islanders beat Red Wings 5-0

Calum Ritchie had a goal and an assist, Matthew Barzal and Bo Horvat also scored, and Casey Cizikas had two assists as the Islanders finished 6-1-0 on a seven-game road trip. It marked the second time in franchise history New York won six or more games on a trip — first since Feb. 19 to March 6, 2016.
Sorokin had five saves in the first period, 15 in the second and nine in the third to get his 24th career shutout.
John Gibson finished with 21 saves as Detroit snapped a four-game point streak (3-0-1).
The Islanders' fourth line of Shabanov, Ritchie and Cizikas accounted for three goals and four assists. Shabanov, playing in his ninth career game, had one goal and two assists prior to Thursday's outburst. The 20-year-old Ritchie scored his second goal of the season and third of his career.
Horvat scored his team-high 14th goal in the second period. He has eight goals and six assists in his last 11 games.
The teams combined for 58 penalty minutes, including three 10-minute misconduct infractions — Detroit's Marco Kasper late in the 2nd period, and the Red Wings' Ben Chiarot and the Islanders' Scott Mayfield at 9:04 of the third.
Ritchie and Shabanov staked the Islanders to a 2-0 lead in the first period. Barzal and Horvat scored during the first six minutes of the second for a four-goal advantage. Shabanov converted a backhander for his second goal at 6:52 of the third.
Red Wings: Host Columbus on Saturday night.
Regular Season SeriesNYI lead series 2-0
Scoring Summary
 |
Goal | 1st Period 6:46 | Calum Ritchie Goal (2) Snap Shot, assists: Max Shabanov (3), Adam Boqvist (1) |
|
Goal | 1st Period 14:54 | Max Shabanov Goal (2) Snap Shot, assists: Casey Cizikas (3), Calum Ritchie (1) |
|
Goal | 2nd Period 3:19 | Mathew Barzal Goal (6) Snap Shot, assists: none |
|
Goal | 2nd Period 5:04 | Bo Horvat Goal (14) Slap Shot, assists: Ryan Pulock (9), Emil Heineman (6) |
|
Goal | 3rd Period 6:52 | Max Shabanov Goal (3) Backhand, assists: Casey Cizikas (4) |
Statistics
 NYI NYI |
 DET DET |
|
|---|---|---|
| 15 | Blocked Shots | 14 |
| 8 | Hits | 23 |
| 4 | Takeaways | 2 |
| 26 | Shots | 29 |
| 0 | Power Play Goals | 0 |
| 4 | Power Play Opportunities | 1 |
| 0.0 | Power Play Percentage | 0.0 |
| 0 | Short Handed Goals | 0 |
| 0 | Shootout Goals | 0 |
| 26 | Faceoffs Won | 36 |
| 41.9 | Faceoff Win Percent | 58.1 |
| 13 | Giveaways | 19 |
| 5 | Total Penalties | 8 |
| 21 | Penalty Minutes | 37 |
 Detroit Red Wings Injuries
| NAME, POS | STATUS | DATE |
|---|---|---|
| Viktor Arvidsson, LW | Out | Jul 1 |
| Mason Appleton, C | Out | Apr 15 |
| Michael Rasmussen, C | Out | Apr 7 |
 New York Islanders Injuries
| NAME, POS | STATUS | DATE |
|---|---|---|
| Mathew Barzal, C | Out | May 12 |
| Semyon Varlamov, G | Injured Reserve | Apr 19 |
| Kyle Palmieri, C | Injured Reserve | Apr 15 |
| Ryan Pulock, D | Out | Apr 14 |
| Alexander Romanov, D | Injured Reserve | Apr 12 |
Game Information
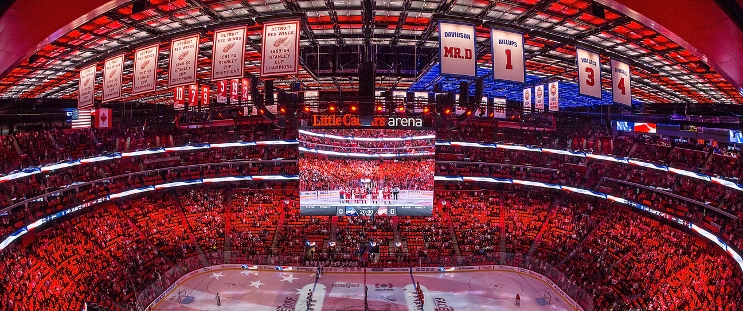 Little Caesars Arena
Location: Detroit, MI
Attendance: 18,918 | Capacity:
Location: Detroit, MI
Attendance: 18,918 | Capacity:
2025-26 Metropolitan Division Standings
| TEAM | W | L | PTS | OTL |
|---|---|---|---|---|
| <img src="https://a.espncdn.com/i/teamlogos/nhl/500/car.png" style="padding: 0 4px; width: 25px; vertical-align: inherit;">Carolina | 53 | 22 | 113 | 7 |
| <img src="https://a.espncdn.com/i/teamlogos/nhl/500/pit.png" style="padding: 0 4px; width: 25px; vertical-align: inherit;">Pittsburgh | 41 | 25 | 98 | 16 |
| <img src="https://a.espncdn.com/i/teamlogos/nhl/500/phi.png" style="padding: 0 4px; width: 25px; vertical-align: inherit;">Philadelphia | 43 | 27 | 98 | 12 |
| <img src="https://a.espncdn.com/i/teamlogos/nhl/500/wsh.png" style="padding: 0 4px; width: 25px; vertical-align: inherit;">Washington | 43 | 30 | 95 | 9 |
| <img src="https://a.espncdn.com/i/teamlogos/nhl/500/cbj.png" style="padding: 0 4px; width: 25px; vertical-align: inherit;">Columbus | 40 | 30 | 92 | 12 |
| <img src="https://a.espncdn.com/i/teamlogos/nhl/500/nyi.png" style="padding: 0 4px; width: 25px; vertical-align: inherit;">NY Islanders | 43 | 34 | 91 | 5 |
| <img src="https://a.espncdn.com/i/teamlogos/nhl/500/nj.png" style="padding: 0 4px; width: 25px; vertical-align: inherit;">New Jersey | 42 | 37 | 87 | 3 |
| <img src="https://a.espncdn.com/i/teamlogos/nhl/500/nyr.png" style="padding: 0 4px; width: 25px; vertical-align: inherit;">NY Rangers | 34 | 39 | 77 | 9 |
2025-26 Atlantic Division Standings
| TEAM | W | L | PTS | OTL |
|---|---|---|---|---|
| <img src="https://a.espncdn.com/i/teamlogos/nhl/500/buf.png" style="padding: 0 4px; width: 25px; vertical-align: inherit;">Buffalo | 50 | 23 | 109 | 9 |
| <img src="https://a.espncdn.com/i/teamlogos/nhl/500/tb.png" style="padding: 0 4px; width: 25px; vertical-align: inherit;">Tampa Bay | 50 | 26 | 106 | 6 |
| <img src="https://a.espncdn.com/i/teamlogos/nhl/500/mtl.png" style="padding: 0 4px; width: 25px; vertical-align: inherit;">Montreal | 48 | 24 | 106 | 10 |
| <img src="https://a.espncdn.com/i/teamlogos/nhl/500/bos.png" style="padding: 0 4px; width: 25px; vertical-align: inherit;">Boston | 45 | 27 | 100 | 10 |
| <img src="https://a.espncdn.com/i/teamlogos/nhl/500/ott.png" style="padding: 0 4px; width: 25px; vertical-align: inherit;">Ottawa | 44 | 27 | 99 | 11 |
| <img src="https://a.espncdn.com/i/teamlogos/nhl/500/det.png" style="padding: 0 4px; width: 25px; vertical-align: inherit;">Detroit | 41 | 31 | 92 | 10 |
| <img src="https://a.espncdn.com/i/teamlogos/nhl/500/fla.png" style="padding: 0 4px; width: 25px; vertical-align: inherit;">Florida | 40 | 38 | 84 | 4 |
| <img src="https://a.espncdn.com/i/teamlogos/nhl/500/tor.png" style="padding: 0 4px; width: 25px; vertical-align: inherit;">Toronto | 32 | 36 | 78 | 14 |