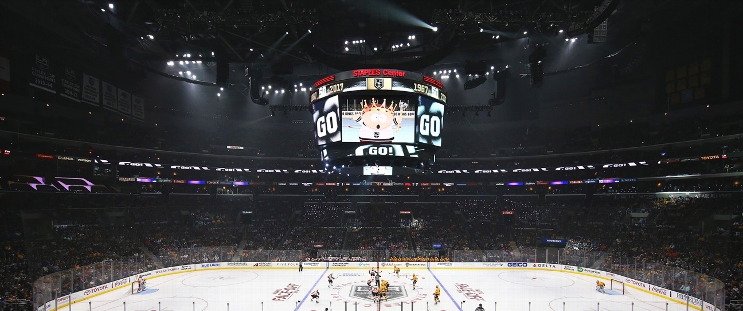
Ottawa Senators at Los Angeles Kings
· National Hockey LeagueClarke's power-play goal ends Kings' 3-game losing streak

Clarke's slap shot from just inside the blue line came with just two seconds left on the man advantage and snapped LA's three-game losing streak.
Warren Foegele also scored for the Kings and Joel Edmundson assisted on both of the team's goals. Darcy Kuemper made 27 saves.
Foegele opened the scoring 5:31 into the third period when he tapped in a pass from Joel Armia, who skated the puck down the right wing. Armia has points in three straight games.
Fabian Zetterlund tied it at 1-1 with 9:11 to play in the third with his third goal of the season and second in two games, but the Senators went scoreless on three power-play opportunities.
Leevi Merilainen made 20 saves for Ottawa, which was coming off wins over Anaheim and San Jose, the first two games of a seven-game road trip.
Kings: Play at the Anaheim Ducks on Friday night.
Regular Season SeriesLA wins series 2-0
Scoring Summary
 |
Goal | 3rd Period 5:31 | Warren Foegele Goal (4) Tip-In, assists: Joel Armia (6), Joel Edmundson (8) |
 |
Goal | 3rd Period 10:49 | Fabian Zetterlund Goal (3) Wrist Shot, assists: Nikolas Matinpalo (3), Nick Jensen (5) |
 |
Goal | 3rd Period 13:50 | Brandt Clarke Goal (3) Slap Shot, assists: Joel Edmundson (9), Corey Perry (6) |
Statistics
 OTT OTT |
 LA LA |
|
|---|---|---|
| 14 | Blocked Shots | 8 |
| 22 | Hits | 14 |
| 4 | Takeaways | 2 |
| 28 | Shots | 22 |
| 0 | Power Play Goals | 1 |
| 3 | Power Play Opportunities | 3 |
| 0.0 | Power Play Percentage | 33.3 |
| 0 | Short Handed Goals | 0 |
| 0 | Shootout Goals | 0 |
| 33 | Faceoffs Won | 15 |
| 68.8 | Faceoff Win Percent | 31.3 |
| 12 | Giveaways | 12 |
| 3 | Total Penalties | 3 |
| 6 | Penalty Minutes | 6 |
 Los Angeles Kings Injuries
| NAME, POS | STATUS | DATE |
|---|---|---|
| Mikey Anderson, D | Injured Reserve | Feb 18 |
| Kevin Fiala, LW | Injured Reserve | Feb 18 |
| Artemi Panarin, LW | Day-To-Day | Feb 6 |
| Andrei Kuzmenko, LW | Day-To-Day | Feb 5 |
| Alex Turcotte, C | Injured Reserve | Jan 31 |
 Ottawa Senators Injuries
| NAME, POS | STATUS | DATE |
|---|---|---|
| Linus Ullmark, G | Day-To-Day | Feb 6 |
| David Perron, LW | Injured Reserve | Jan 23 |
Game Information
 crypto.com Arena
Location: Los Angeles, CA
Attendance: 17,421 | Capacity:

Location: Los Angeles, CA
Attendance: 17,421 | Capacity:
2025-26 Atlantic Division Standings
| TEAM | W | L | PTS | OTL |
|---|---|---|---|---|
 Tampa Bay Tampa Bay |
37 | 14 | 78 | 4 |
 Montreal Montreal |
32 | 17 | 72 | 8 |
 Detroit Detroit |
33 | 19 | 72 | 6 |
 Buffalo Buffalo |
32 | 19 | 70 | 6 |
 Boston Boston |
32 | 20 | 69 | 5 |
 Ottawa Ottawa |
28 | 22 | 63 | 7 |
 Toronto Toronto |
27 | 21 | 63 | 9 |
 Florida Florida |
29 | 25 | 61 | 3 |
2025-26 Pacific Division Standings
| TEAM | W | L | PTS | OTL |
|---|---|---|---|---|
 Vegas Vegas |
27 | 16 | 68 | 14 |
 Edmonton Edmonton |
28 | 22 | 64 | 8 |
 Seattle Seattle |
27 | 20 | 63 | 9 |
 Anaheim Anaheim |
30 | 23 | 63 | 3 |
 Los Angeles Los Angeles |
23 | 19 | 60 | 14 |
 San Jose San Jose |
27 | 24 | 58 | 4 |
 Calgary Calgary |
23 | 27 | 52 | 6 |
 Vancouver Vancouver |
18 | 33 | 42 | 6 |

