
Nashville Predators at Detroit Red Wings
· National Hockey League
6 - 3

Predators score 5 in the 3rd period to end a 3-game slide with 6-3 win over Red Wings

Michael Bunting scored his 100th career goal and added an assist for the Predators, who had gone 2-9-2 over their previous 13 games. O'Reilly also contributed two assists, while Haula, Nick Blankenburg and Steven Stamkos each had a goal and an assist.
Roman Josi scored Nashville's other goal and Justus Annunen stopped 28 shots for his first victory in five decisions this season.
The Predators trailed 2-1 entering the third period.
Alex DeBrincat scored his eighth goal in the last eight games on a power play for Detroit. James van Riemsdyk and Ben Chiarot also scored for the Red Wings. J.T. Compher added an assist in his 600th career game.
Cam Talbot made 22 saves.
The Predators took a 3-2 early in the third period when Blankenburg and Josi scored 15 seconds apart. Chiarot tied it less than a minute later.
O'Reilly scored on a rebound with 5:46 remaining to put the Predators back in front and Haula made it 5-3.
The Predators have been outscored 15-3 during their current three-game losing streak.
Red Wings: Host Tampa Bay on Friday.
Regular Season SeriesNSH leads series 1-0
Scoring Summary
 |
Goal | 1st Period 15:48 | Michael Bunting Goal (5) Tip-In, assists: Nick Blankenburg (6), Erik Haula (9) |
 |
Goal | 2nd Period 5:30 | Alex DeBrincat Goal (12) Snap Shot, assists: Dylan Larkin (13), Lucas Raymond (18) |
|
Goal | 2nd Period 16:34 | James van Riemsdyk Goal (3) Snap Shot, assists: Patrick Kane (10), Nate Danielson (3) |
|
Goal | 3rd Period 2:05 | Nick Blankenburg Goal (3) Backhand, assists: Ryan O'Reilly (8) |
|
Goal | 3rd Period 2:20 | Roman Josi Goal (2) Snap Shot, assists: Michael Bunting (8), Michael McCarron (4) |
|
Goal | 3rd Period 3:04 | Ben Chiarot Goal (3) Wrist Shot, assists: Mason Appleton (6), J.T. Compher (4) |
|
Goal | 3rd Period 14:14 | Ryan O'Reilly Goal (7) Snap Shot, assists: Luke Evangelista (10), Steven Stamkos (2) |
|
Goal | 3rd Period 14:42 | Erik Haula Goal (4) Snap Shot, assists: Filip Forsberg (8), Jonathan Marchessault (3) |
|
Goal | 3rd Period 18:45 | Steven Stamkos Goal (5) Snap Shot, assists: Ryan O'Reilly (9), Luke Evangelista (11) |
Statistics
 NSH NSH |
 DET DET |
|
|---|---|---|
| 8 | Blocked Shots | 17 |
| 22 | Hits | 13 |
| 3 | Takeaways | 3 |
| 29 | Shots | 31 |
| 1 | Power Play Goals | 2 |
| 4 | Power Play Opportunities | 4 |
| 25.0 | Power Play Percentage | 50.0 |
| 0 | Short Handed Goals | 0 |
| 0 | Shootout Goals | 0 |
| 34 | Faceoffs Won | 37 |
| 47.9 | Faceoff Win Percent | 52.1 |
| 7 | Giveaways | 14 |
| 5 | Total Penalties | 5 |
| 10 | Penalty Minutes | 10 |
 Detroit Red Wings Injuries
| NAME, POS | STATUS | DATE |
|---|---|---|
| Viktor Arvidsson, LW | Out | Jul 1 |
| Mason Appleton, C | Out | Apr 15 |
| Michael Rasmussen, C | Out | Apr 7 |
 Nashville Predators Injuries
| NAME, POS | STATUS | DATE |
|---|
Game Information
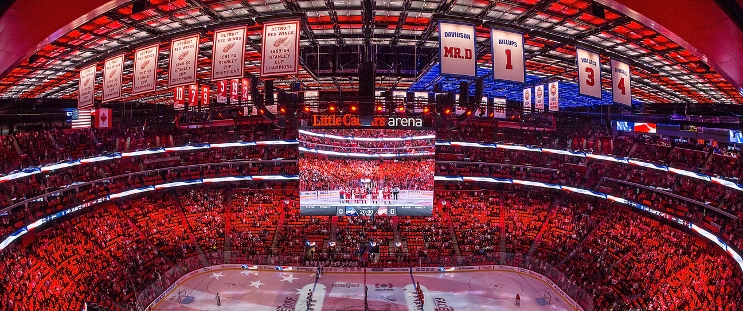 Little Caesars Arena
Location: Detroit, MI
Attendance: 19,515 | Capacity:
Location: Detroit, MI
Attendance: 19,515 | Capacity:
2025-26 Central Division Standings
| TEAM | W | L | PTS | OTL |
|---|---|---|---|---|
| <img src="https://a.espncdn.com/i/teamlogos/nhl/500/col.png" style="padding: 0 4px; width: 25px; vertical-align: inherit;">Colorado | 55 | 16 | 121 | 11 |
| <img src="https://a.espncdn.com/i/teamlogos/nhl/500/dal.png" style="padding: 0 4px; width: 25px; vertical-align: inherit;">Dallas | 50 | 20 | 112 | 12 |
| <img src="https://a.espncdn.com/i/teamlogos/nhl/500/min.png" style="padding: 0 4px; width: 25px; vertical-align: inherit;">Minnesota | 46 | 24 | 104 | 12 |
| <img src="https://a.espncdn.com/i/teamlogos/nhl/500/uta.png" style="padding: 0 4px; width: 25px; vertical-align: inherit;">Utah | 43 | 33 | 92 | 6 |
| <img src="https://a.espncdn.com/i/teamlogos/nhl/500/stl.png" style="padding: 0 4px; width: 25px; vertical-align: inherit;">St. Louis | 37 | 33 | 86 | 12 |
| <img src="https://a.espncdn.com/i/teamlogos/nhl/500/nsh.png" style="padding: 0 4px; width: 25px; vertical-align: inherit;">Nashville | 38 | 34 | 86 | 10 |
| <img src="https://a.espncdn.com/i/teamlogos/nhl/500/wpg.png" style="padding: 0 4px; width: 25px; vertical-align: inherit;">Winnipeg | 35 | 35 | 82 | 12 |
| <img src="https://a.espncdn.com/i/teamlogos/nhl/500/chi.png" style="padding: 0 4px; width: 25px; vertical-align: inherit;">Chicago | 29 | 39 | 72 | 14 |
2025-26 Atlantic Division Standings
| TEAM | W | L | PTS | OTL |
|---|---|---|---|---|
| <img src="https://a.espncdn.com/i/teamlogos/nhl/500/buf.png" style="padding: 0 4px; width: 25px; vertical-align: inherit;">Buffalo | 50 | 23 | 109 | 9 |
| <img src="https://a.espncdn.com/i/teamlogos/nhl/500/tb.png" style="padding: 0 4px; width: 25px; vertical-align: inherit;">Tampa Bay | 50 | 26 | 106 | 6 |
| <img src="https://a.espncdn.com/i/teamlogos/nhl/500/mtl.png" style="padding: 0 4px; width: 25px; vertical-align: inherit;">Montreal | 48 | 24 | 106 | 10 |
| <img src="https://a.espncdn.com/i/teamlogos/nhl/500/bos.png" style="padding: 0 4px; width: 25px; vertical-align: inherit;">Boston | 45 | 27 | 100 | 10 |
| <img src="https://a.espncdn.com/i/teamlogos/nhl/500/ott.png" style="padding: 0 4px; width: 25px; vertical-align: inherit;">Ottawa | 44 | 27 | 99 | 11 |
| <img src="https://a.espncdn.com/i/teamlogos/nhl/500/det.png" style="padding: 0 4px; width: 25px; vertical-align: inherit;">Detroit | 41 | 31 | 92 | 10 |
| <img src="https://a.espncdn.com/i/teamlogos/nhl/500/fla.png" style="padding: 0 4px; width: 25px; vertical-align: inherit;">Florida | 40 | 38 | 84 | 4 |
| <img src="https://a.espncdn.com/i/teamlogos/nhl/500/tor.png" style="padding: 0 4px; width: 25px; vertical-align: inherit;">Toronto | 32 | 36 | 78 | 14 |