
Toronto Maple Leafs at Columbus Blue Jackets
· National Hockey League
2 - 1

Nylander sets OT goals record as Maple Leafs beat Blue Jackets 2-1

Nylander got the pass from defenseman Oliver Ekman-Larsson and put it past Columbus goaltender Jet Greaves to give Toronto only its second win in last nine games.
Nylander moved past Auston Matthews and Mats Sundin on the team's OT list. The Maple Leafs have seven comeback victories this season, fourth-most in the league.
Nylander also had an assist on Easton Cowan's tying goal in the third period for Toronto, which got its first victory two stops into a six-game trip. Joseph Woll stopped 35 shots.
Ekman-Larsson became the fifth Maple Leafs defenseman since 1991-92 to have a seven-game points streak.
Zach Werenski scored for Columbus, which had its fourth overtime loss in its last 10 games. Greaves had 22 saves.
Besides getting the win, the Maple Leafs had centers Matthews and Nicolas Roy return to the lineup after being activated off injured reserve.
Werenski took a pass from Miles Wood crossing the blue line and then skated to the left corner before beating Toronto goaltender Joseph Woll with a wrist shot on the short side at 13:30 of the third.
It was the Werenski’s eighth goal of the season and fourth in six games.
It also was Werenski’s 121st in 10 seasons with Columbus, moving him into fifth place in franchise history.
Werenski appeared to give the Blue Jackets the lead at 13:04 of the second period, but it was taken off the board when Toronto successfully challenged that Columbus was offside.
Cowan evened it at 16:43 with his second of the year on a snap shot from a difficult angle that went over the shoulder and blocker of Greaves.
Blue Jackets: Host Pittsburgh on Friday night.
Regular Season SeriesCBJ win series 2-1
Scoring Summary
 |
Goal | 3rd Period 13:30 | Zach Werenski Goal (8) Snap Shot, assists: Miles Wood (1) |
 |
Goal | 3rd Period 16:43 | Easton Cowan Goal (2) Snap Shot, assists: William Nylander (20), John Tavares (16) |
|
Goal | 4th Period 4:40 | William Nylander Goal (11) Wrist Shot, assists: Oliver Ekman-Larsson (14), Matthew Knies (18) |
Statistics
 TOR TOR |
 CBJ CBJ |
|
|---|---|---|
| 13 | Blocked Shots | 12 |
| 21 | Hits | 20 |
| 6 | Takeaways | 4 |
| 24 | Shots | 36 |
| 0 | Power Play Goals | 0 |
| 2 | Power Play Opportunities | 3 |
| 0.0 | Power Play Percentage | 0.0 |
| 0 | Short Handed Goals | 0 |
| 0 | Shootout Goals | 0 |
| 35 | Faceoffs Won | 24 |
| 59.3 | Faceoff Win Percent | 40.7 |
| 19 | Giveaways | 15 |
| 4 | Total Penalties | 3 |
| 8 | Penalty Minutes | 6 |
 Columbus Blue Jackets Injuries
| NAME, POS | STATUS | DATE |
|---|
 Toronto Maple Leafs Injuries
| NAME, POS | STATUS | DATE |
|---|---|---|
| Zack MacEwen, C | Injured Reserve | Jul 1 |
| Max Domi, C | Out | May 25 |
| Calle Jarnkrok, C | Out | Apr 15 |
| Dakota Joshua, C | Out | Apr 11 |
| Auston Matthews, C | Out | Mar 19 |
Game Information
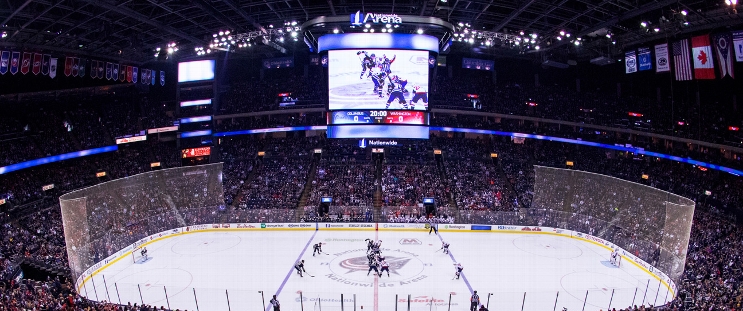 Nationwide Arena
Location: Columbus, OH
Attendance: 16,632 | Capacity:
Location: Columbus, OH
Attendance: 16,632 | Capacity:
2025-26 Atlantic Division Standings
| TEAM | W | L | PTS | OTL |
|---|---|---|---|---|
| <img src="https://a.espncdn.com/i/teamlogos/nhl/500/buf.png" style="padding: 0 4px; width: 25px; vertical-align: inherit;">Buffalo | 50 | 23 | 109 | 9 |
| <img src="https://a.espncdn.com/i/teamlogos/nhl/500/tb.png" style="padding: 0 4px; width: 25px; vertical-align: inherit;">Tampa Bay | 50 | 26 | 106 | 6 |
| <img src="https://a.espncdn.com/i/teamlogos/nhl/500/mtl.png" style="padding: 0 4px; width: 25px; vertical-align: inherit;">Montreal | 48 | 24 | 106 | 10 |
| <img src="https://a.espncdn.com/i/teamlogos/nhl/500/bos.png" style="padding: 0 4px; width: 25px; vertical-align: inherit;">Boston | 45 | 27 | 100 | 10 |
| <img src="https://a.espncdn.com/i/teamlogos/nhl/500/ott.png" style="padding: 0 4px; width: 25px; vertical-align: inherit;">Ottawa | 44 | 27 | 99 | 11 |
| <img src="https://a.espncdn.com/i/teamlogos/nhl/500/det.png" style="padding: 0 4px; width: 25px; vertical-align: inherit;">Detroit | 41 | 31 | 92 | 10 |
| <img src="https://a.espncdn.com/i/teamlogos/nhl/500/fla.png" style="padding: 0 4px; width: 25px; vertical-align: inherit;">Florida | 40 | 38 | 84 | 4 |
| <img src="https://a.espncdn.com/i/teamlogos/nhl/500/tor.png" style="padding: 0 4px; width: 25px; vertical-align: inherit;">Toronto | 32 | 36 | 78 | 14 |
2025-26 Metropolitan Division Standings
| TEAM | W | L | PTS | OTL |
|---|---|---|---|---|
| <img src="https://a.espncdn.com/i/teamlogos/nhl/500/car.png" style="padding: 0 4px; width: 25px; vertical-align: inherit;">Carolina | 53 | 22 | 113 | 7 |
| <img src="https://a.espncdn.com/i/teamlogos/nhl/500/pit.png" style="padding: 0 4px; width: 25px; vertical-align: inherit;">Pittsburgh | 41 | 25 | 98 | 16 |
| <img src="https://a.espncdn.com/i/teamlogos/nhl/500/phi.png" style="padding: 0 4px; width: 25px; vertical-align: inherit;">Philadelphia | 43 | 27 | 98 | 12 |
| <img src="https://a.espncdn.com/i/teamlogos/nhl/500/wsh.png" style="padding: 0 4px; width: 25px; vertical-align: inherit;">Washington | 43 | 30 | 95 | 9 |
| <img src="https://a.espncdn.com/i/teamlogos/nhl/500/cbj.png" style="padding: 0 4px; width: 25px; vertical-align: inherit;">Columbus | 40 | 30 | 92 | 12 |
| <img src="https://a.espncdn.com/i/teamlogos/nhl/500/nyi.png" style="padding: 0 4px; width: 25px; vertical-align: inherit;">NY Islanders | 43 | 34 | 91 | 5 |
| <img src="https://a.espncdn.com/i/teamlogos/nhl/500/nj.png" style="padding: 0 4px; width: 25px; vertical-align: inherit;">New Jersey | 42 | 37 | 87 | 3 |
| <img src="https://a.espncdn.com/i/teamlogos/nhl/500/nyr.png" style="padding: 0 4px; width: 25px; vertical-align: inherit;">NY Rangers | 34 | 39 | 77 | 9 |