
San Jose Sharks at Colorado Avalanche
· National Hockey League
0 - 6

Avalanche win 10th straight, shut out Sharks 6-0

The Avalanche’s win streak is the longest by an NHL team this season and is tied for the second-longest in franchise history. They also extended their point streak to an NHL-high 14 games, with a 12-0-2 record in that time.
Artturi Lehkonen, Ross Colton, Sam Malinski, Josh Manson and Joel Kiviranta also scored for Colorado, which had three goals in 76 seconds in the second period to stretch its lead to 5-0.
The Avalanche recorded a shutout for the third-consecutive game, the first time they’ve done so since the 2001-02 season. They’ve gone 189 minutes and 17 seconds without allowing a goal. It was the second shutout in as many starts for Blackwood, who had given up 10 goals in his previous three appearances this season.
MacKinnon, Cale Makar and Martin Necas were among the nine Colorado players with an assist. Makar’s assist was his 21st of the season, the second-most in the NHL.
The Sharks were the last team the Avalanche had failed to beat, losing 3-2 in overtime against San Jose on Nov. 1.
Yaroslav Askarov was pulled from the game in the second period after giving up four goals on 19 shots. Nine seconds later, his replacement, Alex Nedeljkovic, allowed a goal on the first shot he faced.
In the shutout loss, Macklin Celebrini’s five-game point streak was snapped.
Sharks: Host Vancouver on Friday.
Regular Season SeriesSeries tied 1-1
Scoring Summary
 |
Goal | 1st Period 3:39 | Ross Colton Goal (5) Snap Shot, assists: none |
|
Goal | 1st Period 19:07 | Nathan MacKinnon Goal (18) Slap Shot, assists: Cale Makar (21), Gabriel Landeskog (6) |
|
Goal | 2nd Period 3:44 | Sam Malinski Goal (2) Wrist Shot, assists: Artturi Lehkonen (12), Martin Necas (16) |
|
Goal | 2nd Period 4:51 | Josh Manson Goal (2) Wrist Shot, assists: Victor Olofsson (10), Parker Kelly (6) |
|
Goal | 2nd Period 5:00 | Joel Kiviranta Goal (1) Snap Shot, assists: Ivan Ivan (1), Zakhar Bardakov (4) |
|
Goal | 3rd Period 16:15 | Artturi Lehkonen Goal (9) Snap Shot, assists: Nathan MacKinnon (21), Martin Necas (17) |
Statistics
 SJ SJ |
 COL COL |
|
|---|---|---|
| 18 | Blocked Shots | 22 |
| 22 | Hits | 10 |
| 5 | Takeaways | 2 |
| 26 | Shots | 42 |
| 0 | Power Play Goals | 1 |
| 4 | Power Play Opportunities | 4 |
| 0.0 | Power Play Percentage | 25.0 |
| 0 | Short Handed Goals | 0 |
| 0 | Shootout Goals | 0 |
| 27 | Faceoffs Won | 29 |
| 48.2 | Faceoff Win Percent | 51.8 |
| 13 | Giveaways | 12 |
| 4 | Total Penalties | 4 |
| 8 | Penalty Minutes | 8 |
 Colorado Avalanche Injuries
| NAME, POS | STATUS | DATE |
|---|---|---|
| Jaden Schwartz, C | Out | Jul 1 |
 San Jose Sharks Injuries
| NAME, POS | STATUS | DATE |
|---|---|---|
| Ryan Reaves, RW | Out | Apr 10 |
| Logan Couture, C | Injured Reserve | Sep 30 |
Game Information
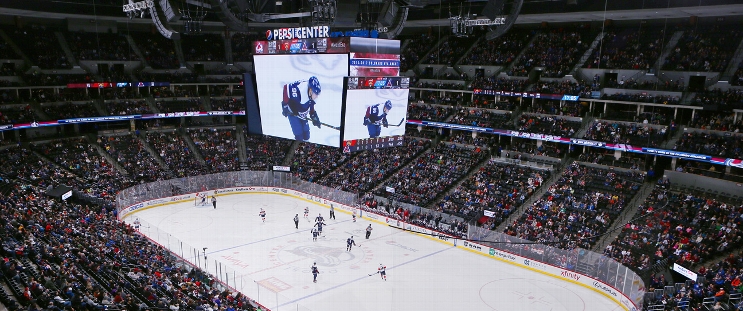 Ball Arena
Location: Denver, CO
Attendance: 18,117 | Capacity:
Location: Denver, CO
Attendance: 18,117 | Capacity:
2025-26 Pacific Division Standings
| TEAM | W | L | PTS | OTL |
|---|---|---|---|---|
| <img src="https://a.espncdn.com/i/teamlogos/nhl/500/vgk.png" style="padding: 0 4px; width: 25px; vertical-align: inherit;">Vegas | 39 | 26 | 95 | 17 |
| <img src="https://a.espncdn.com/i/teamlogos/nhl/500/edm.png" style="padding: 0 4px; width: 25px; vertical-align: inherit;">Edmonton | 41 | 30 | 93 | 11 |
| <img src="https://a.espncdn.com/i/teamlogos/nhl/500/ana.png" style="padding: 0 4px; width: 25px; vertical-align: inherit;">Anaheim | 43 | 33 | 92 | 6 |
| <img src="https://a.espncdn.com/i/teamlogos/nhl/500/la.png" style="padding: 0 4px; width: 25px; vertical-align: inherit;">Los Angeles | 35 | 27 | 90 | 20 |
| <img src="https://a.espncdn.com/i/teamlogos/nhl/500/sj.png" style="padding: 0 4px; width: 25px; vertical-align: inherit;">San Jose | 39 | 35 | 86 | 8 |
| <img src="https://a.espncdn.com/i/teamlogos/nhl/500/sea.png" style="padding: 0 4px; width: 25px; vertical-align: inherit;">Seattle | 34 | 37 | 79 | 11 |
| <img src="https://a.espncdn.com/i/teamlogos/nhl/500/cgy.png" style="padding: 0 4px; width: 25px; vertical-align: inherit;">Calgary | 34 | 39 | 77 | 9 |
| <img src="https://a.espncdn.com/i/teamlogos/nhl/500/van.png" style="padding: 0 4px; width: 25px; vertical-align: inherit;">Vancouver | 25 | 49 | 58 | 8 |
2025-26 Central Division Standings
| TEAM | W | L | PTS | OTL |
|---|---|---|---|---|
| <img src="https://a.espncdn.com/i/teamlogos/nhl/500/col.png" style="padding: 0 4px; width: 25px; vertical-align: inherit;">Colorado | 55 | 16 | 121 | 11 |
| <img src="https://a.espncdn.com/i/teamlogos/nhl/500/dal.png" style="padding: 0 4px; width: 25px; vertical-align: inherit;">Dallas | 50 | 20 | 112 | 12 |
| <img src="https://a.espncdn.com/i/teamlogos/nhl/500/min.png" style="padding: 0 4px; width: 25px; vertical-align: inherit;">Minnesota | 46 | 24 | 104 | 12 |
| <img src="https://a.espncdn.com/i/teamlogos/nhl/500/uta.png" style="padding: 0 4px; width: 25px; vertical-align: inherit;">Utah | 43 | 33 | 92 | 6 |
| <img src="https://a.espncdn.com/i/teamlogos/nhl/500/stl.png" style="padding: 0 4px; width: 25px; vertical-align: inherit;">St. Louis | 37 | 33 | 86 | 12 |
| <img src="https://a.espncdn.com/i/teamlogos/nhl/500/nsh.png" style="padding: 0 4px; width: 25px; vertical-align: inherit;">Nashville | 38 | 34 | 86 | 10 |
| <img src="https://a.espncdn.com/i/teamlogos/nhl/500/wpg.png" style="padding: 0 4px; width: 25px; vertical-align: inherit;">Winnipeg | 35 | 35 | 82 | 12 |
| <img src="https://a.espncdn.com/i/teamlogos/nhl/500/chi.png" style="padding: 0 4px; width: 25px; vertical-align: inherit;">Chicago | 29 | 39 | 72 | 14 |