
Tampa Bay Lightning at Detroit Red Wings
· National Hockey League
6 - 3

Gourde's unassisted goals power Lightning past Red Wings 6-3 for sixth straight victory

Darren Raddysh had a goal and two assists for Tampa Bay, while Jake Guentzel supplied a goal and an assist. Gage Goncalves and Brandon Hagel also scored for the Lightning.
Nikita Kucherov extended his point streak to eight games with two assists. He has four goals and 11 assists during that span.
Andrei Vasilevskiy stopped 33 shots to extend his personal winning streak to six games. Vailevskiy has limited opponents to a combined seven goals during that stretch.
J.T. Compher and Michael Rasmussen led Detroit's offense with a goal and an assist apiece. Dylan Larkin added his team-high 14th goal and John Gibson made 22 saves. The Red Wings have lost three straight.
Lightning forward Brayden Point missed his third consecutive game because of an undisclosed injury.
The game was tied at 1-1 after the first period. Compher opened the scoring with a shot from the right circle. Raddysh answered with a slapshot past Gibson during a Lightning power play.
The Lightning led 4-3 after two periods. Goncalves and Gourde took advantage of Detroit defensive errors in the first 3:01 of the period but Rasmussen quickly answered by tapping in a rebound. Gourde and Larkin traded goals in the last four minutes of the period.
Guentzel's tip-in of a shot by Raddysh with 7:23 remaining and Hagel's empty-netter with 2:47 left clinched the Lightning's victory.
Red Wings: Visit the Boston Bruins on Saturday.
Regular Season SeriesSeries tied 1-1
Scoring Summary
 |
Goal | 1st Period 11:29 | J.T. Compher Goal (4) Snap Shot, assists: Michael Rasmussen (4) |
 |
Goal | 1st Period 17:07 | Darren Raddysh Goal (3) Slap Shot, assists: Nikita Kucherov (17), Jake Guentzel (13) |
|
Goal | 2nd Period 0:34 | Gage Goncalves Goal (2) Snap Shot, assists: Oliver Bjorkstrand (7), Nick Paul (2) |
|
Goal | 2nd Period 3:01 | Yanni Gourde Goal (4) Snap Shot, assists: none |
|
Goal | 2nd Period 3:13 | Michael Rasmussen Goal (3) Backhand, assists: J.T. Compher (5) |
|
Goal | 2nd Period 16:09 | Yanni Gourde Goal (5) Slap Shot, assists: none |
|
Goal | 2nd Period 18:26 | Dylan Larkin Goal (14) Snap Shot, assists: Lucas Raymond (19), Simon Edvinsson (4) |
|
Goal | 3rd Period 12:37 | Jake Guentzel Goal (13) Tip-In, assists: Darren Raddysh (9), Nikita Kucherov (18) |
|
Goal | 3rd Period 17:13 | Brandon Hagel Goal (13) Wrist Shot, assists: Darren Raddysh (10) |
Statistics
 TB TB |
 DET DET |
|
|---|---|---|
| 4 | Blocked Shots | 16 |
| 15 | Hits | 20 |
| 4 | Takeaways | 7 |
| 27 | Shots | 37 |
| 1 | Power Play Goals | 0 |
| 1 | Power Play Opportunities | 1 |
| 100.0 | Power Play Percentage | 0.0 |
| 0 | Short Handed Goals | 0 |
| 0 | Shootout Goals | 0 |
| 30 | Faceoffs Won | 27 |
| 52.6 | Faceoff Win Percent | 47.4 |
| 12 | Giveaways | 12 |
| 2 | Total Penalties | 2 |
| 4 | Penalty Minutes | 4 |
 Detroit Red Wings Injuries
| NAME, POS | STATUS | DATE |
|---|---|---|
| Viktor Arvidsson, LW | Out | Jul 1 |
| Mason Appleton, C | Out | Apr 15 |
| Michael Rasmussen, C | Out | Apr 7 |
 Tampa Bay Lightning Injuries
| NAME, POS | STATUS | DATE |
|---|---|---|
| Pontus Holmberg, RW | Out | May 5 |
Game Information
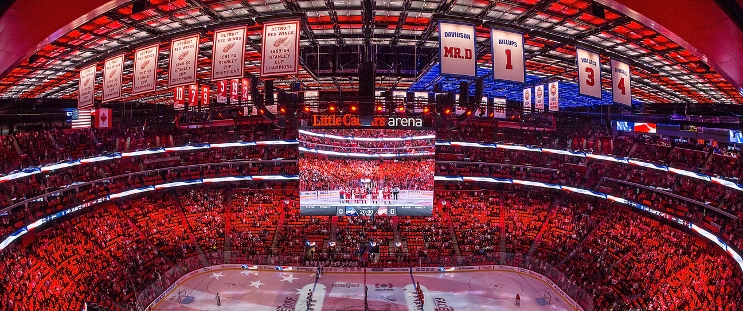 Little Caesars Arena
Location: Detroit, MI
Attendance: 19,515 | Capacity:
Location: Detroit, MI
Attendance: 19,515 | Capacity:
2025-26 Atlantic Division Standings
| TEAM | W | L | PTS | OTL |
|---|---|---|---|---|
| <img src="https://a.espncdn.com/i/teamlogos/nhl/500/buf.png" style="padding: 0 4px; width: 25px; vertical-align: inherit;">Buffalo | 50 | 23 | 109 | 9 |
| <img src="https://a.espncdn.com/i/teamlogos/nhl/500/tb.png" style="padding: 0 4px; width: 25px; vertical-align: inherit;">Tampa Bay | 50 | 26 | 106 | 6 |
| <img src="https://a.espncdn.com/i/teamlogos/nhl/500/mtl.png" style="padding: 0 4px; width: 25px; vertical-align: inherit;">Montreal | 48 | 24 | 106 | 10 |
| <img src="https://a.espncdn.com/i/teamlogos/nhl/500/bos.png" style="padding: 0 4px; width: 25px; vertical-align: inherit;">Boston | 45 | 27 | 100 | 10 |
| <img src="https://a.espncdn.com/i/teamlogos/nhl/500/ott.png" style="padding: 0 4px; width: 25px; vertical-align: inherit;">Ottawa | 44 | 27 | 99 | 11 |
| <img src="https://a.espncdn.com/i/teamlogos/nhl/500/det.png" style="padding: 0 4px; width: 25px; vertical-align: inherit;">Detroit | 41 | 31 | 92 | 10 |
| <img src="https://a.espncdn.com/i/teamlogos/nhl/500/fla.png" style="padding: 0 4px; width: 25px; vertical-align: inherit;">Florida | 40 | 38 | 84 | 4 |
| <img src="https://a.espncdn.com/i/teamlogos/nhl/500/tor.png" style="padding: 0 4px; width: 25px; vertical-align: inherit;">Toronto | 32 | 36 | 78 | 14 |