
Ottawa Senators at Dallas Stars
· National Hockey League
1 - 6

Johnston's hat trick leads Stars past Senators 6-1 for 4th consecutive win

Johnston also had an assist to match a season high with four points.
Mavrik Bourque and Jamie Benn also scored for the Stars, who have won four consecutive games and are 10-1-1 in their last 12 games.
Dallas backup goaltender Casey DeSmith is 6-0-2 after making 15 saves. Dallas allowed just 16 shots on goal, which was a season low for both teams.
Robertson’s goal came 44 seconds after Jake Sanderson tied the score 1-1. Dallas outscored Ottawa 3-1 in the second period following a scoreless first.
Johnston and Robertson share the team lead with 16 goals each, tied for fourth in the NHL. Robertson has points in 10 of his last 11 games (13 goals, 9 assists) and leads Dallas with 35 points (fifth).
Linus Ullmark stopped 20 shots for the Senators, who are 3-3-0 heading into the finale of a season-long seven-game road trip.
The Stars’ 38 points are second most in the NHL but four behind league-leading Colorado in the Central Division.
Dallas’ NHL-best power play has scored 29 times in 26 games. Last season, the Stars’ 29th power-play goal came in game No. 49 on Jan. 26.
Mikko Rantanen had a season-high three assists.
The Senators went 6-4-3 in November, their first winning mark in the month since 2016-17.
Stars defenseman Lian Bichsel left late in the second period with an apparent injury to his left leg. He went into the boards after getting hung up with Ottawa’s Fabian Zetterlund. Coach Glen Gulutzan said after the game that Bichsel will be evaluated on Monday.
Stars: Begin a road back-to-back on Monday against the New York Rangers.
Regular Season SeriesDAL wins series 2-0
Scoring Summary
 |
Goal | 2nd Period 1:58 | Mavrik Bourque Goal (4) Tip-In, assists: Ilya Lyubushkin (5), Oskar Bäck (3) |
 |
Goal | 2nd Period 8:36 | Jake Sanderson Goal (5) Wrist Shot, assists: David Perron (9), Nick Cousins (3) |
|
Goal | 2nd Period 9:20 | Jason Robertson Goal (16) Wrist Shot, assists: none |
|
Goal | 2nd Period 15:33 | Wyatt Johnston Goal (14) Snap Shot, assists: Mikko Rantanen (21), Jason Robertson (18) |
|
Goal | 3rd Period 2:52 | Wyatt Johnston Goal (15) Snap Shot, assists: Mikko Rantanen (22), Roope Hintz (13) |
|
Goal | 3rd Period 7:24 | Jamie Benn Goal (3) Snap Shot, assists: Mikko Rantanen (23), Wyatt Johnston (14) |
|
Goal | 3rd Period 15:41 | Wyatt Johnston Goal (16) Snap Shot, assists: Roope Hintz (14), Jason Robertson (19) |
Statistics
 OTT OTT |
 DAL DAL |
|
|---|---|---|
| 9 | Blocked Shots | 11 |
| 31 | Hits | 21 |
| 5 | Takeaways | 6 |
| 16 | Shots | 26 |
| 0 | Power Play Goals | 2 |
| 3 | Power Play Opportunities | 4 |
| 0.0 | Power Play Percentage | 50.0 |
| 0 | Short Handed Goals | 0 |
| 0 | Shootout Goals | 0 |
| 29 | Faceoffs Won | 28 |
| 50.9 | Faceoff Win Percent | 49.1 |
| 18 | Giveaways | 15 |
| 5 | Total Penalties | 4 |
| 10 | Penalty Minutes | 8 |
 Dallas Stars Injuries
| NAME, POS | STATUS | DATE |
|---|---|---|
| Arttu Hyry, RW | Out | Jul 1 |
| Roope Hintz, C | Out | May 4 |
| Tyler Seguin, C | Injured Reserve | May 4 |
| Nils Lundkvist, D | Out | Apr 29 |
 Ottawa Senators Injuries
| NAME, POS | STATUS | DATE |
|---|---|---|
| Ridly Greig, C | Suspension | May 4 |
| Artem Zub, D | Out | Apr 27 |
| Jake Sanderson, D | Out | Apr 24 |
Game Information
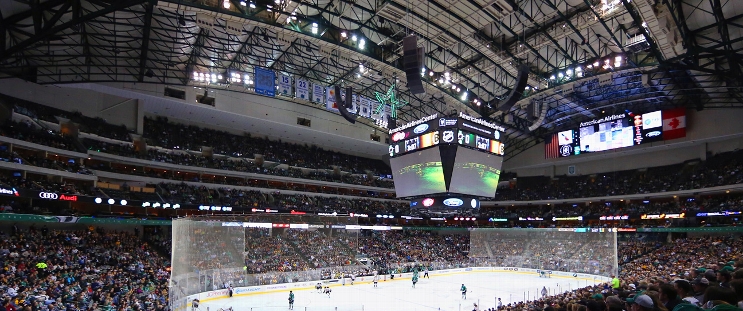 American Airlines Center
Location: Dallas, TX
Attendance: 18,532 | Capacity:
Location: Dallas, TX
Attendance: 18,532 | Capacity:
2025-26 Atlantic Division Standings
| TEAM | W | L | PTS | OTL |
|---|---|---|---|---|
| <img src="https://a.espncdn.com/i/teamlogos/nhl/500/buf.png" style="padding: 0 4px; width: 25px; vertical-align: inherit;">Buffalo | 50 | 23 | 109 | 9 |
| <img src="https://a.espncdn.com/i/teamlogos/nhl/500/tb.png" style="padding: 0 4px; width: 25px; vertical-align: inherit;">Tampa Bay | 50 | 26 | 106 | 6 |
| <img src="https://a.espncdn.com/i/teamlogos/nhl/500/mtl.png" style="padding: 0 4px; width: 25px; vertical-align: inherit;">Montreal | 48 | 24 | 106 | 10 |
| <img src="https://a.espncdn.com/i/teamlogos/nhl/500/bos.png" style="padding: 0 4px; width: 25px; vertical-align: inherit;">Boston | 45 | 27 | 100 | 10 |
| <img src="https://a.espncdn.com/i/teamlogos/nhl/500/ott.png" style="padding: 0 4px; width: 25px; vertical-align: inherit;">Ottawa | 44 | 27 | 99 | 11 |
| <img src="https://a.espncdn.com/i/teamlogos/nhl/500/det.png" style="padding: 0 4px; width: 25px; vertical-align: inherit;">Detroit | 41 | 31 | 92 | 10 |
| <img src="https://a.espncdn.com/i/teamlogos/nhl/500/fla.png" style="padding: 0 4px; width: 25px; vertical-align: inherit;">Florida | 40 | 38 | 84 | 4 |
| <img src="https://a.espncdn.com/i/teamlogos/nhl/500/tor.png" style="padding: 0 4px; width: 25px; vertical-align: inherit;">Toronto | 32 | 36 | 78 | 14 |
2025-26 Central Division Standings
| TEAM | W | L | PTS | OTL |
|---|---|---|---|---|
| <img src="https://a.espncdn.com/i/teamlogos/nhl/500/col.png" style="padding: 0 4px; width: 25px; vertical-align: inherit;">Colorado | 55 | 16 | 121 | 11 |
| <img src="https://a.espncdn.com/i/teamlogos/nhl/500/dal.png" style="padding: 0 4px; width: 25px; vertical-align: inherit;">Dallas | 50 | 20 | 112 | 12 |
| <img src="https://a.espncdn.com/i/teamlogos/nhl/500/min.png" style="padding: 0 4px; width: 25px; vertical-align: inherit;">Minnesota | 46 | 24 | 104 | 12 |
| <img src="https://a.espncdn.com/i/teamlogos/nhl/500/uta.png" style="padding: 0 4px; width: 25px; vertical-align: inherit;">Utah | 43 | 33 | 92 | 6 |
| <img src="https://a.espncdn.com/i/teamlogos/nhl/500/stl.png" style="padding: 0 4px; width: 25px; vertical-align: inherit;">St. Louis | 37 | 33 | 86 | 12 |
| <img src="https://a.espncdn.com/i/teamlogos/nhl/500/nsh.png" style="padding: 0 4px; width: 25px; vertical-align: inherit;">Nashville | 38 | 34 | 86 | 10 |
| <img src="https://a.espncdn.com/i/teamlogos/nhl/500/wpg.png" style="padding: 0 4px; width: 25px; vertical-align: inherit;">Winnipeg | 35 | 35 | 82 | 12 |
| <img src="https://a.espncdn.com/i/teamlogos/nhl/500/chi.png" style="padding: 0 4px; width: 25px; vertical-align: inherit;">Chicago | 29 | 39 | 72 | 14 |