
Tampa Bay Lightning at New York Islanders
· National Hockey League

Horvat and Duclair score as Islanders end Lightning's 7-game win streak with 2-1 victory

Ilya Sorokin made 28 saves for his eighth win of the season as the Islanders snapped a three-game skid.
Dominic James scored and Andrei Vasilevskiy stopped 21 shots for the Lightning, who lead the Atlantic Division.
The Islanders opened the scoring 55 seconds into the second period when Horvat corralled his own rebound and buried it. Horvat, who leads New York with 16 goals, is making a strong case to represent Team Canada at the 2026 Olympics in Milan.
Duclair doubled the lead at 5:30 of the third. Callum Ritchie, the 20-year-old forward acquired as the headline piece in last season’s Brock Nelson trade, picked up an assist.
James spoiled Sorokin’s shutout bid with a sharp-angled shot with 4:34 remaining in the third.
Islanders: Host the Colorado Avalanche on Thursday, concluding a seven-game homestand.
Regular Season SeriesNYI lead series 1-0
Scoring Summary
 |
Goal | 2nd Period 0:55 | Bo Horvat Goal (16) Wrist Shot, assists: Max Shabanov (5) |
|
Goal | 3rd Period 5:30 | Anthony Duclair Goal (4) Snap Shot, assists: Calum Ritchie (2), Tony DeAngelo (9) |
 |
Goal | 3rd Period 16:26 | Dominic James Goal (2) Wrist Shot, assists: Emil Lilleberg (4), Nick Paul (3) |
Statistics
 TB TB |
 NYI NYI |
|
|---|---|---|
| 7 | Blocked Shots | 19 |
| 14 | Hits | 19 |
| 4 | Takeaways | 3 |
| 31 | Shots | 24 |
| 0 | Power Play Goals | 0 |
| 3 | Power Play Opportunities | 3 |
| 0.0 | Power Play Percentage | 0.0 |
| 0 | Short Handed Goals | 0 |
| 0 | Shootout Goals | 0 |
| 22 | Faceoffs Won | 20 |
| 52.4 | Faceoff Win Percent | 47.6 |
| 13 | Giveaways | 17 |
| 3 | Total Penalties | 3 |
| 6 | Penalty Minutes | 6 |
 New York Islanders Injuries
| NAME, POS | STATUS | DATE |
|---|---|---|
| Bo Horvat, C | Out | Jan 16 |
| Kyle Palmieri, C | Injured Reserve | Nov 30 |
 Tampa Bay Lightning Injuries
| NAME, POS | STATUS | DATE |
|---|---|---|
| Anthony Cirelli, C | Day-To-Day | Jan 20 |
| Brayden Point, C | Injured Reserve | Jan 16 |
| Ryan McDonagh, D | Injured Reserve | Jan 9 |
| Scott Sabourin, RW | Injured Reserve | Dec 30 |
| Victor Hedman, D | Injured Reserve | Dec 12 |
Game Information
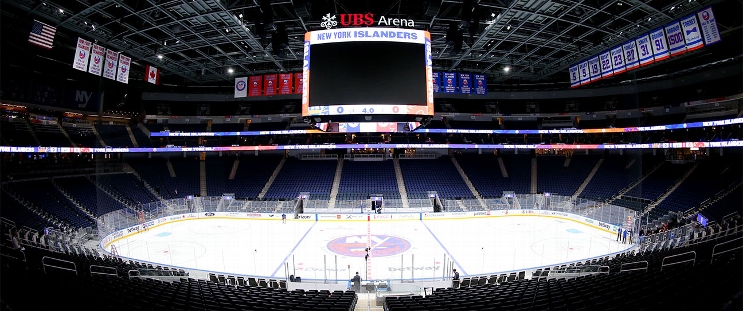 UBS Arena
Location: Elmont, NY
Attendance: 13,014 | Capacity:
Location: Elmont, NY
Attendance: 13,014 | Capacity:
2025-26 Atlantic Division Standings
| TEAM | W | L | PTS | OTL |
|---|---|---|---|---|
 Tampa Bay Tampa Bay |
31 | 13 | 66 | 4 |
 Detroit Detroit |
31 | 16 | 66 | 4 |
 Montreal Montreal |
28 | 15 | 63 | 7 |
 Buffalo Buffalo |
27 | 17 | 59 | 5 |
 Boston Boston |
28 | 20 | 58 | 2 |
 Toronto Toronto |
24 | 17 | 57 | 9 |
 Florida Florida |
25 | 20 | 53 | 3 |
 Ottawa Ottawa |
23 | 19 | 53 | 7 |
2025-26 Metropolitan Division Standings
| TEAM | W | L | PTS | OTL |
|---|---|---|---|---|
 Carolina Carolina |
31 | 15 | 66 | 4 |
 Pittsburgh Pittsburgh |
24 | 14 | 59 | 11 |
 NY Islanders NY Islanders |
27 | 18 | 59 | 5 |
 Philadelphia Philadelphia |
23 | 17 | 55 | 9 |
 New Jersey New Jersey |
26 | 22 | 54 | 2 |
 Washington Washington |
24 | 21 | 54 | 6 |
 Columbus Columbus |
22 | 20 | 51 | 7 |
 NY Rangers NY Rangers |
21 | 24 | 48 | 6 |