
San Jose Sharks at Dallas Stars
· National Hockey League
1 - 4

Rantanen has goal and 2 assists as Stars beat Sharks 4-1 to extend point streak to nine games

Jason Robertson, Sam Steel and Miro Heiskanen also scored and Wyatt Johnston had two assists for Dallas, which won its second straight and extended its point streak to nine games (7-0-2). Jake Oettinger finished with 16 saves.
Colin Graf scored for San Jose, which lost its second straight. Yaroslav Askarov had 20 saves.
Steel put the Stars ahead 2-1 with 9:04 remaining as he pushed in the rebound of his own shot. Askarov made the stop on his initial attempt from the right circle, but the puck was loose on the left side. As the goalie tried to gather it, Steel rushed in and knocked it through Askarov's pads.
Rantanen pushed it to 3-1 as he beat Askarov over his glove hand from the right circle with 3:21 to go for his 13th goal of the season.
Macklin Celebrini appeared to pull the Sharks back within one with 2:44 remaining, but the goal was overturned on review after a challenge for offside.
Heiskanen sealed it with a long empty-netter 25 seconds later.
Robertson gave the Stars a 1-0 lead with 5:40 left in the first as he knocked in a rebound into an open net from the left side. Askarov made the stop on Wyatt Johnston’s one-timer from the slot, but the puck went up and off the crossbar and dropped on the ice on the left side, where Robertson gathered it and backhanded it in for his 18th.
Graf tied it 1-1 as he scored 8:23 into the second on a rebound after Nick Leddy's shot was blocked in front. It came on the Sharks' fifth shot on goal of the game.
Stars: Host Pittsburgh on Sunday.
Regular Season SeriesDAL leads series 1-0
Scoring Summary
 |
Goal | 1st Period 14:20 | Jason Robertson Goal (18) Backhand, assists: Wyatt Johnston (16), Mikko Rantanen (24) |
 |
Goal | 2nd Period 8:23 | Collin Graf Goal (4) Wrist Shot, assists: Ty Dellandrea (7), Nick Leddy (3) |
|
Goal | 3rd Period 10:56 | Sam Steel Goal (4) Snap Shot, assists: Alexander Petrovic (7), Mikko Rantanen (25) |
|
Goal | 3rd Period 16:39 | Mikko Rantanen Goal (13) Wrist Shot, assists: Wyatt Johnston (17), Vladislav Kolyachonok (2) |
|
Goal | 3rd Period 17:41 | Miro Heiskanen Goal (5) Wrist Shot, assists: Roope Hintz (16) |
Statistics
 SJ SJ |
 DAL DAL |
|
|---|---|---|
| 9 | Blocked Shots | 17 |
| 24 | Hits | 17 |
| 6 | Takeaways | 6 |
| 17 | Shots | 24 |
| 0 | Power Play Goals | 1 |
| 4 | Power Play Opportunities | 2 |
| 0.0 | Power Play Percentage | 50.0 |
| 0 | Short Handed Goals | 0 |
| 0 | Shootout Goals | 0 |
| 24 | Faceoffs Won | 30 |
| 44.4 | Faceoff Win Percent | 55.6 |
| 13 | Giveaways | 10 |
| 3 | Total Penalties | 5 |
| 6 | Penalty Minutes | 10 |
 Dallas Stars Injuries
| NAME, POS | STATUS | DATE |
|---|---|---|
| Arttu Hyry, RW | Out | Jul 1 |
| Roope Hintz, C | Out | May 4 |
| Tyler Seguin, C | Injured Reserve | May 4 |
| Nils Lundkvist, D | Out | Apr 29 |
 San Jose Sharks Injuries
| NAME, POS | STATUS | DATE |
|---|---|---|
| Ryan Reaves, RW | Out | Apr 10 |
| Logan Couture, C | Injured Reserve | Sep 30 |
Game Information
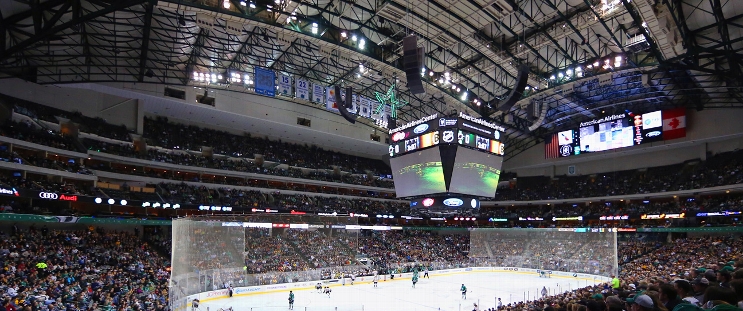 American Airlines Center
Location: Dallas, TX
Attendance: 18,532 | Capacity:
Location: Dallas, TX
Attendance: 18,532 | Capacity:
2025-26 Pacific Division Standings
| TEAM | W | L | PTS | OTL |
|---|---|---|---|---|
| <img src="https://a.espncdn.com/i/teamlogos/nhl/500/vgk.png" style="padding: 0 4px; width: 25px; vertical-align: inherit;">Vegas | 39 | 26 | 95 | 17 |
| <img src="https://a.espncdn.com/i/teamlogos/nhl/500/edm.png" style="padding: 0 4px; width: 25px; vertical-align: inherit;">Edmonton | 41 | 30 | 93 | 11 |
| <img src="https://a.espncdn.com/i/teamlogos/nhl/500/ana.png" style="padding: 0 4px; width: 25px; vertical-align: inherit;">Anaheim | 43 | 33 | 92 | 6 |
| <img src="https://a.espncdn.com/i/teamlogos/nhl/500/la.png" style="padding: 0 4px; width: 25px; vertical-align: inherit;">Los Angeles | 35 | 27 | 90 | 20 |
| <img src="https://a.espncdn.com/i/teamlogos/nhl/500/sj.png" style="padding: 0 4px; width: 25px; vertical-align: inherit;">San Jose | 39 | 35 | 86 | 8 |
| <img src="https://a.espncdn.com/i/teamlogos/nhl/500/sea.png" style="padding: 0 4px; width: 25px; vertical-align: inherit;">Seattle | 34 | 37 | 79 | 11 |
| <img src="https://a.espncdn.com/i/teamlogos/nhl/500/cgy.png" style="padding: 0 4px; width: 25px; vertical-align: inherit;">Calgary | 34 | 39 | 77 | 9 |
| <img src="https://a.espncdn.com/i/teamlogos/nhl/500/van.png" style="padding: 0 4px; width: 25px; vertical-align: inherit;">Vancouver | 25 | 49 | 58 | 8 |
2025-26 Central Division Standings
| TEAM | W | L | PTS | OTL |
|---|---|---|---|---|
| <img src="https://a.espncdn.com/i/teamlogos/nhl/500/col.png" style="padding: 0 4px; width: 25px; vertical-align: inherit;">Colorado | 55 | 16 | 121 | 11 |
| <img src="https://a.espncdn.com/i/teamlogos/nhl/500/dal.png" style="padding: 0 4px; width: 25px; vertical-align: inherit;">Dallas | 50 | 20 | 112 | 12 |
| <img src="https://a.espncdn.com/i/teamlogos/nhl/500/min.png" style="padding: 0 4px; width: 25px; vertical-align: inherit;">Minnesota | 46 | 24 | 104 | 12 |
| <img src="https://a.espncdn.com/i/teamlogos/nhl/500/uta.png" style="padding: 0 4px; width: 25px; vertical-align: inherit;">Utah | 43 | 33 | 92 | 6 |
| <img src="https://a.espncdn.com/i/teamlogos/nhl/500/stl.png" style="padding: 0 4px; width: 25px; vertical-align: inherit;">St. Louis | 37 | 33 | 86 | 12 |
| <img src="https://a.espncdn.com/i/teamlogos/nhl/500/nsh.png" style="padding: 0 4px; width: 25px; vertical-align: inherit;">Nashville | 38 | 34 | 86 | 10 |
| <img src="https://a.espncdn.com/i/teamlogos/nhl/500/wpg.png" style="padding: 0 4px; width: 25px; vertical-align: inherit;">Winnipeg | 35 | 35 | 82 | 12 |
| <img src="https://a.espncdn.com/i/teamlogos/nhl/500/chi.png" style="padding: 0 4px; width: 25px; vertical-align: inherit;">Chicago | 29 | 39 | 72 | 14 |