
Montreal Canadiens at New York Rangers
· National Hockey League
4 - 5

Miller scores 2, including OT winner, as Rangers beat Canadiens 5-4

Will Cuylle, Noah Laba and Artemi Panarin also scored to help the Rangers snap a three-game skid (0-1-2). Mathew Robertson and Conor Sheary each had two assists, and Igor Shesterkin had 12 saves.
Zach Bolduc, Arber Xhekaj, Jake Evans and Josh Anderson scored for Montreal in its third loss in four games (1-2-1). Nick Suzuki and Lane Hutson each had two assists, and Jacob Fowler had 21 saves.
In the extra period, Miller beat Fowler for his ninth goal to give the Rangers the win after they trailed 3-0 and 4-2.
The teams combined for eight goals in the opening 28 minutes, then none until overtime.
Cuylle and Miller scored in a 36-second span early in the second period to tie the score 4-4. Cuylle got his ninth at 7:22 and Miller tied it at 7:58.
Bolduc opened the scoring with 7:19 left in the first period with his seventh. Xhekej made it 2-0 with his first wit 5:50 left in the period, and Evans made it a three-goal lead 2:08 later with his fifth.
Laba then beat Fowler on the power play with 1:11 left in the opening period to get the Rangers on the board.
Panarin scored on a penalty shot 19 seconds to make it 3-2.
Anderson restored the two-goal margin at 3:17 of the second, whipping a one-timer past Shesterkin.
The Rangers honored players from the 1970s and 80s. Attendees included Hall of Fame defenseman Brad Park, Swedish stars Anders Hedberg and Ulf Nilsson plus family members of Rod Gilbert, Jean Ratelle and Vic Hadfield. Herb Brooks, the 1980 “Miracle on Ice” Olympic coach who coached the Rangers from 1981-85, was represented by his son Dan.
Rangers: Host Anaheim on Monday night.
Regular Season SeriesNYR lead series 2-0
Scoring Summary
 |
Goal | 1st Period 12:41 | Zachary Bolduc Goal (7) Wrist Shot, assists: Nick Suzuki (27), Cole Caufield (16) |
|
Goal | 1st Period 14:10 | Arber Xhekaj Goal (1) Wrist Shot, assists: Alexandre Carrier (8), Alexandre Texier (4) |
|
Goal | 1st Period 16:18 | Jake Evans Goal (5) Snap Shot, assists: Lane Hutson (20), Joseph Veleno (1) |
 |
Goal | 1st Period 18:49 | Noah Laba Goal (5) Wrist Shot, assists: Will Cuylle (9), Conor Sheary (7) |
|
Goal | 1st Period 19:08 | Artemi Panarin Goal (11) Wrist Shot, assists: none |
|
Goal | 2nd Period 3:17 | Josh Anderson Goal (6) Slap Shot, assists: Lane Hutson (21), Nick Suzuki (28) |
|
Goal | 2nd Period 7:22 | Will Cuylle Goal (9) Wrist Shot, assists: Matthew Robertson (3), Noah Laba (5) |
|
Goal | 2nd Period 7:58 | J.T. Miller Goal (8) Backhand, assists: Matthew Robertson (4), Conor Sheary (8) |
|
Goal | 4th Period 2:56 | J.T. Miller Goal (9) Slap Shot, assists: Mika Zibanejad (14), Vincent Trocheck (10) |
Statistics
 MTL MTL |
 NYR NYR |
|
|---|---|---|
| 23 | Blocked Shots | 18 |
| 21 | Hits | 32 |
| 7 | Takeaways | 4 |
| 18 | Shots | 29 |
| 0 | Power Play Goals | 2 |
| 1 | Power Play Opportunities | 2 |
| 0.0 | Power Play Percentage | 100.0 |
| 0 | Short Handed Goals | 0 |
| 0 | Shootout Goals | 0 |
| 23 | Faceoffs Won | 26 |
| 46.9 | Faceoff Win Percent | 53.1 |
| 13 | Giveaways | 14 |
| 3 | Total Penalties | 2 |
| 6 | Penalty Minutes | 4 |
 New York Rangers Injuries
| NAME, POS | STATUS | DATE |
|---|---|---|
| Matt Rempe, C | Injured Reserve | Mar 23 |
 Montreal Canadiens Injuries
| NAME, POS | STATUS | DATE |
|---|
Game Information
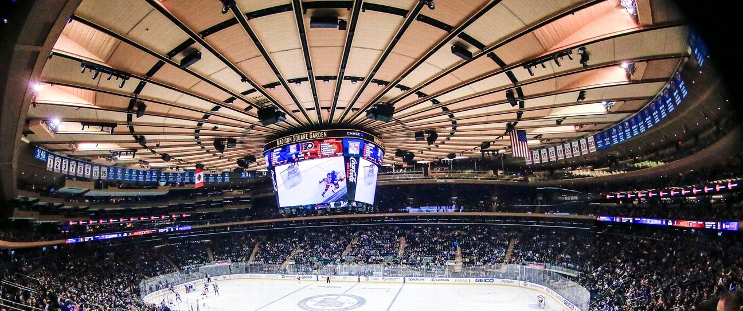 Madison Square Garden
Location: New York, NY
Attendance: 18,006 | Capacity:
Location: New York, NY
Attendance: 18,006 | Capacity:
2025-26 Atlantic Division Standings
| TEAM | W | L | PTS | OTL |
|---|---|---|---|---|
| <img src="https://a.espncdn.com/i/teamlogos/nhl/500/buf.png" style="padding: 0 4px; width: 25px; vertical-align: inherit;">Buffalo | 50 | 23 | 109 | 9 |
| <img src="https://a.espncdn.com/i/teamlogos/nhl/500/tb.png" style="padding: 0 4px; width: 25px; vertical-align: inherit;">Tampa Bay | 50 | 26 | 106 | 6 |
| <img src="https://a.espncdn.com/i/teamlogos/nhl/500/mtl.png" style="padding: 0 4px; width: 25px; vertical-align: inherit;">Montreal | 48 | 24 | 106 | 10 |
| <img src="https://a.espncdn.com/i/teamlogos/nhl/500/bos.png" style="padding: 0 4px; width: 25px; vertical-align: inherit;">Boston | 45 | 27 | 100 | 10 |
| <img src="https://a.espncdn.com/i/teamlogos/nhl/500/ott.png" style="padding: 0 4px; width: 25px; vertical-align: inherit;">Ottawa | 44 | 27 | 99 | 11 |
| <img src="https://a.espncdn.com/i/teamlogos/nhl/500/det.png" style="padding: 0 4px; width: 25px; vertical-align: inherit;">Detroit | 41 | 31 | 92 | 10 |
| <img src="https://a.espncdn.com/i/teamlogos/nhl/500/fla.png" style="padding: 0 4px; width: 25px; vertical-align: inherit;">Florida | 40 | 38 | 84 | 4 |
| <img src="https://a.espncdn.com/i/teamlogos/nhl/500/tor.png" style="padding: 0 4px; width: 25px; vertical-align: inherit;">Toronto | 32 | 36 | 78 | 14 |
2025-26 Metropolitan Division Standings
| TEAM | W | L | PTS | OTL |
|---|---|---|---|---|
| <img src="https://a.espncdn.com/i/teamlogos/nhl/500/car.png" style="padding: 0 4px; width: 25px; vertical-align: inherit;">Carolina | 53 | 22 | 113 | 7 |
| <img src="https://a.espncdn.com/i/teamlogos/nhl/500/pit.png" style="padding: 0 4px; width: 25px; vertical-align: inherit;">Pittsburgh | 41 | 25 | 98 | 16 |
| <img src="https://a.espncdn.com/i/teamlogos/nhl/500/phi.png" style="padding: 0 4px; width: 25px; vertical-align: inherit;">Philadelphia | 43 | 27 | 98 | 12 |
| <img src="https://a.espncdn.com/i/teamlogos/nhl/500/wsh.png" style="padding: 0 4px; width: 25px; vertical-align: inherit;">Washington | 43 | 30 | 95 | 9 |
| <img src="https://a.espncdn.com/i/teamlogos/nhl/500/cbj.png" style="padding: 0 4px; width: 25px; vertical-align: inherit;">Columbus | 40 | 30 | 92 | 12 |
| <img src="https://a.espncdn.com/i/teamlogos/nhl/500/nyi.png" style="padding: 0 4px; width: 25px; vertical-align: inherit;">NY Islanders | 43 | 34 | 91 | 5 |
| <img src="https://a.espncdn.com/i/teamlogos/nhl/500/nj.png" style="padding: 0 4px; width: 25px; vertical-align: inherit;">New Jersey | 42 | 37 | 87 | 3 |
| <img src="https://a.espncdn.com/i/teamlogos/nhl/500/nyr.png" style="padding: 0 4px; width: 25px; vertical-align: inherit;">NY Rangers | 34 | 39 | 77 | 9 |