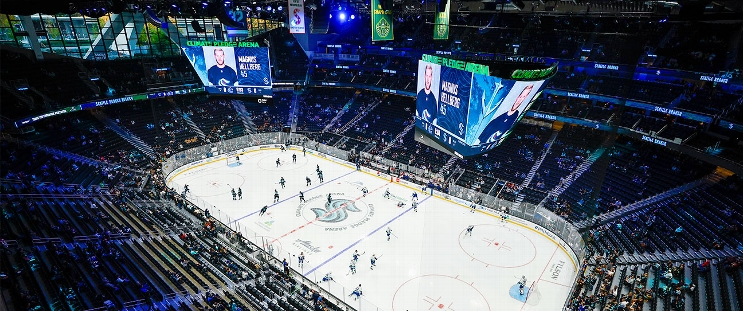
Buffalo Sabres at Seattle Kraken
· National Hockey League
Regular Season Series
Series starts 12/14
Statistics
 BUF BUF |
 SEA SEA |
|
|---|---|---|
| 3.27 | Goals Against Average | 2.87 |
| 31.5 | Shots Against per Game | 27.2 |
| 89.6 | Penalty Kill Percentage | 69.2 |
| 5 | Power Play Goals Against | 12 |
| 0 | Short Handed Goals Against | 0 |
| 2.67 | Goals For per Game | 2.60 |
| 28.9 | Shots per Game | 25.2 |
| 8 | Power Play Goals | 9 |
| 17.4 | Power Play Percentage | 19.6 |
| 2 | Short Handed Goals | 0 |
| 162 | Penalty Minutes | 119 |
 Seattle Kraken Injuries
| NAME, POS | STATUS | DATE |
|---|---|---|
| Joey Daccord, G | Injured Reserve | Nov 8 |
| Jared McCann, LW | Injured Reserve | Oct 25 |
| Max McCormick, LW | Out | Sep 30 |
 Buffalo Sabres Injuries
| NAME, POS | STATUS | DATE |
|---|---|---|
| Jason Zucker, LW | Injured Reserve | Nov 10 |
| Zach Benson, LW | Injured Reserve | Nov 10 |
| Jiri Kulich, C | Injured Reserve | Nov 10 |
| Rasmus Dahlin, D | Injured Reserve | Nov 7 |
Game Information
 Climate Pledge Arena
Location: Seattle, WA
Capacity:

Climate Pledge Arena
Location: Seattle, WA
Capacity:
2025-26 Atlantic Division Standings
| TEAM | W | L | PTS | OTL |
|---|---|---|---|---|
 Montreal Montreal |
10 | 3 | 22 | 2 |
 Boston Boston |
10 | 7 | 20 | 0 |
 Ottawa Ottawa |
8 | 5 | 19 | 3 |
 Tampa Bay Tampa Bay |
8 | 5 | 18 | 2 |
 Detroit Detroit |
9 | 7 | 18 | 0 |
 Toronto Toronto |
8 | 7 | 17 | 1 |
 Florida Florida |
7 | 7 | 15 | 1 |
 Buffalo Buffalo |
5 | 6 | 14 | 4 |
2025-26 Pacific Division Standings
| TEAM | W | L | PTS | OTL |
|---|---|---|---|---|
 Anaheim Anaheim |
11 | 3 | 23 | 1 |
 Vegas Vegas |
7 | 3 | 18 | 4 |
 Seattle Seattle |
7 | 4 | 18 | 4 |
 Los Angeles Los Angeles |
7 | 5 | 18 | 4 |
 San Jose San Jose |
7 | 6 | 17 | 3 |
 Vancouver Vancouver |
8 | 8 | 17 | 1 |
 Edmonton Edmonton |
6 | 6 | 16 | 4 |
 Calgary Calgary |
4 | 11 | 10 | 2 |


 WSH
WSH UTA
UTA STL
STL CAR
CAR NYR
NYR CHI
CHI DAL
DAL