
Washington Capitals at Minnesota Wild
· National Hockey League

Kaprizov, Tarasenko, Gustavsson help Wild stay hot with 5-0 victory over Capitals

The Wild are an NHL-best 17-3-2 since Nov. 1 and 3-0 since Quinn Hughes on Friday via one of the NHL’s biggest blockbuster trades in recent memory.
Washington has lost three in a row and been outshot 183-134 in its past five games.
Kaprizov’s backhand score with 7:09 left in the second period moved him past Zach Parise for the club’s career lead in power-play goals with 70. It was also Kaprizov’s 206th career goal, surpassing Mikko Koivu for second in the team’s 25-year history.
With his third shutout of the season, Gustavsson is tied for second in the league in shutouts — one behind teammate Jesper Wallstedt. The duo has allowed a league low 39 goals since Nov. 1.
With 14 career shutouts, Gustavsson is one shy of tying Dwayne Roloson (15) for third in franchise history.
An already short-handed Wild roster worked with five defensemen after Daemon Hunt left midway through the first with an apparent knee injury. Hughes, who leads all NHL skaters in time on ice, played a game-high 29:33 on Tuesday.
Tarasenko found the net on his team's first shot, scored off a third-period faceoff, then later deked around two defenders to set up a goal by Danila Yurov.
Yurov, a rookie, added two assists for the first three-point game of his career.
Charlie Lindgren made 27 saves for the Capitals, who went 0-2 on their road trip to Winnipeg and the Twin Cities.
Minnesota: At Columbus on Thursday night.
Regular Season SeriesSeries tied 1-1
Scoring Summary
 |
Goal | 1st Period 2:09 | Vladimir Tarasenko Goal (4) Wrist Shot, assists: Danila Yurov (6), Brock Faber (12) |
|
Goal | 2nd Period 12:51 | Kirill Kaprizov Goal (21) Backhand, assists: Joel Eriksson Ek (17), Quinn Hughes (22) |
|
Goal | 3rd Period 4:23 | Vladimir Tarasenko Goal (5) Wrist Shot, assists: Danila Yurov (7) |
|
Goal | 3rd Period 8:53 | Danila Yurov Goal (4) Wrist Shot, assists: Vladimir Tarasenko (11) |
|
Goal | 3rd Period 14:12 | Matt Boldy Goal (19) Wrist Shot, assists: Matt Kiersted (1) |
Statistics
 WSH WSH |
 MIN MIN |
|
|---|---|---|
| 8 | Blocked Shots | 21 |
| 18 | Hits | 22 |
| 4 | Takeaways | 3 |
| 25 | Shots | 32 |
| 0 | Power Play Goals | 1 |
| 2 | Power Play Opportunities | 4 |
| 0.0 | Power Play Percentage | 25.0 |
| 0 | Short Handed Goals | 1 |
| 0 | Shootout Goals | 0 |
| 27 | Faceoffs Won | 30 |
| 47.4 | Faceoff Win Percent | 52.6 |
| 9 | Giveaways | 18 |
| 4 | Total Penalties | 2 |
| 8 | Penalty Minutes | 4 |
 Minnesota Wild Injuries
| NAME, POS | STATUS | DATE |
|---|---|---|
| Nico Sturm, C | Day-To-Day | Feb 1 |
| Jonas Brodin, D | Injured Reserve | Jan 26 |
| Zach Bogosian, D | Injured Reserve | Jan 24 |
 Washington Capitals Injuries
| NAME, POS | STATUS | DATE |
|---|---|---|
| Martin Fehervary, D | Day-To-Day | Feb 1 |
| Logan Thompson, G | Day-To-Day | Jan 31 |
| Charlie Lindgren, G | Injured Reserve | Jan 31 |
| Matt Roy, D | Injured Reserve | Jan 31 |
| Connor McMichael, C | Injured Reserve | Jan 31 |
Game Information
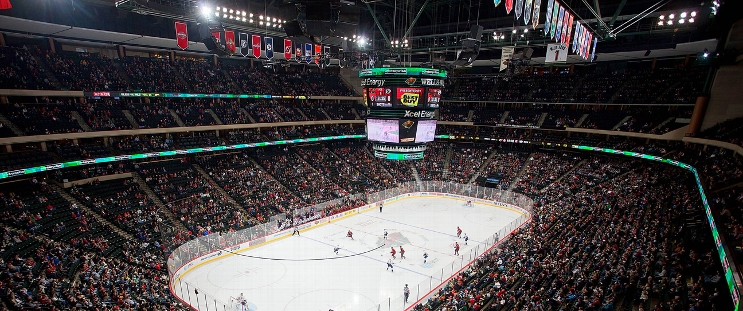 Grand Casino Arena
Location: Saint Paul, MN
Attendance: 18,044 | Capacity:
Location: Saint Paul, MN
Attendance: 18,044 | Capacity:
2025-26 Metropolitan Division Standings
| TEAM | W | L | PTS | OTL |
|---|---|---|---|---|
 Carolina Carolina |
33 | 15 | 72 | 6 |
 Pittsburgh Pittsburgh |
28 | 14 | 67 | 11 |
 NY Islanders NY Islanders |
30 | 20 | 65 | 5 |
 Columbus Columbus |
27 | 20 | 61 | 7 |
 Washington Washington |
27 | 22 | 61 | 7 |
 Philadelphia Philadelphia |
24 | 20 | 58 | 10 |
 New Jersey New Jersey |
28 | 25 | 58 | 2 |
 NY Rangers NY Rangers |
22 | 28 | 50 | 6 |
2025-26 Central Division Standings
| TEAM | W | L | PTS | OTL |
|---|---|---|---|---|
 Colorado Colorado |
36 | 8 | 81 | 9 |
 Minnesota Minnesota |
32 | 14 | 74 | 10 |
 Dallas Dallas |
32 | 14 | 73 | 9 |
 Utah Utah |
28 | 23 | 60 | 4 |
 Nashville Nashville |
25 | 23 | 56 | 6 |
 Winnipeg Winnipeg |
22 | 25 | 51 | 7 |
 Chicago Chicago |
21 | 25 | 51 | 9 |
 St. Louis St. Louis |
20 | 26 | 49 | 9 |