
Winnipeg Jets at Detroit Red Wings
· National Hockey League
1 - 2

John Gibson makes 24 saves as surging Red Wings beat slumping Jets, 2-1

Gibson won for the ninth time in 10 starts as the Red Wings improved to 11-3-1 in December.
The Jets lost their seventh straight game (0-4-3) on a night where Connor Hellebuyck made 17 saves. Logan Stanley scored Winnipeg's goal.
The Red Wings took a 1-0 lead at 8:22 of the first period when Larkin ripped a shot through traffic over Hellebuyck's glove while on the power play. Larkin and Hellebuyck, who grew up a few miles apart in Detroit's western suburbs, are expected to be teammates on Team USA in the upcoming Olympics.
Appleton put the Red Wings ahead 2-0 with 5:12 left in the first, finishing off a two-on-one break with J.T. Compher. Hellebuyck made the initial save, but defenseman Luke Schenn knocked the puck into the net while trying to clear the crease.
Gustav Nyquist nearly made it 2-1 late in the second period against his former team, but hit the crossbar from a sharp angle.
Stanley made it 2-1 at 7:04 of the third with a shot along the ice that seemed to fool Gibson.
Red Wings: Visit the Pittsburgh Penguins on Thursday night.
Regular Season SeriesDET leads series 1-0
Scoring Summary
 |
Goal | 1st Period 8:22 | Dylan Larkin Goal (21) Snap Shot, assists: Moritz Seider (24), Lucas Raymond (32) |
|
Goal | 1st Period 14:48 | Mason Appleton Goal (5) Snap Shot, assists: J.T. Compher (9), Michael Rasmussen (8) |
 |
Goal | 3rd Period 7:04 | Logan Stanley Goal (7) Wrist Shot, assists: Jonathan Toews (8) |
Statistics
 WPG WPG |
 DET DET |
|
|---|---|---|
| 11 | Blocked Shots | 20 |
| 24 | Hits | 14 |
| 6 | Takeaways | 4 |
| 24 | Shots | 19 |
| 0 | Power Play Goals | 1 |
| 3 | Power Play Opportunities | 3 |
| 0.0 | Power Play Percentage | 33.3 |
| 0 | Short Handed Goals | 0 |
| 0 | Shootout Goals | 0 |
| 23 | Faceoffs Won | 24 |
| 48.9 | Faceoff Win Percent | 51.1 |
| 13 | Giveaways | 12 |
| 3 | Total Penalties | 3 |
| 6 | Penalty Minutes | 6 |
 Detroit Red Wings Injuries
| NAME, POS | STATUS | DATE |
|---|---|---|
| Viktor Arvidsson, LW | Out | Jul 1 |
| Mason Appleton, C | Out | Apr 15 |
| Michael Rasmussen, C | Out | Apr 7 |
 Winnipeg Jets Injuries
| NAME, POS | STATUS | DATE |
|---|---|---|
| Elias Salomonsson, D | Out | Apr 30 |
| Neal Pionk, D | Out | Apr 16 |
| Vladislav Namestnikov, C | Out | Apr 16 |
| Gustav Nyquist, RW | Out | Apr 16 |
| Alex Iafallo, LW | Out | Apr 16 |
Game Information
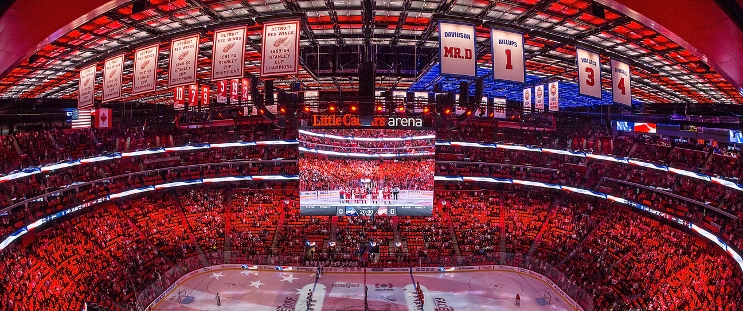 Little Caesars Arena
Location: Detroit, MI
Attendance: 19,515 | Capacity:
Location: Detroit, MI
Attendance: 19,515 | Capacity:
2025-26 Central Division Standings
| TEAM | W | L | PTS | OTL |
|---|---|---|---|---|
| <img src="https://a.espncdn.com/i/teamlogos/nhl/500/col.png" style="padding: 0 4px; width: 25px; vertical-align: inherit;">Colorado | 55 | 16 | 121 | 11 |
| <img src="https://a.espncdn.com/i/teamlogos/nhl/500/dal.png" style="padding: 0 4px; width: 25px; vertical-align: inherit;">Dallas | 50 | 20 | 112 | 12 |
| <img src="https://a.espncdn.com/i/teamlogos/nhl/500/min.png" style="padding: 0 4px; width: 25px; vertical-align: inherit;">Minnesota | 46 | 24 | 104 | 12 |
| <img src="https://a.espncdn.com/i/teamlogos/nhl/500/uta.png" style="padding: 0 4px; width: 25px; vertical-align: inherit;">Utah | 43 | 33 | 92 | 6 |
| <img src="https://a.espncdn.com/i/teamlogos/nhl/500/stl.png" style="padding: 0 4px; width: 25px; vertical-align: inherit;">St. Louis | 37 | 33 | 86 | 12 |
| <img src="https://a.espncdn.com/i/teamlogos/nhl/500/nsh.png" style="padding: 0 4px; width: 25px; vertical-align: inherit;">Nashville | 38 | 34 | 86 | 10 |
| <img src="https://a.espncdn.com/i/teamlogos/nhl/500/wpg.png" style="padding: 0 4px; width: 25px; vertical-align: inherit;">Winnipeg | 35 | 35 | 82 | 12 |
| <img src="https://a.espncdn.com/i/teamlogos/nhl/500/chi.png" style="padding: 0 4px; width: 25px; vertical-align: inherit;">Chicago | 29 | 39 | 72 | 14 |
2025-26 Atlantic Division Standings
| TEAM | W | L | PTS | OTL |
|---|---|---|---|---|
| <img src="https://a.espncdn.com/i/teamlogos/nhl/500/buf.png" style="padding: 0 4px; width: 25px; vertical-align: inherit;">Buffalo | 50 | 23 | 109 | 9 |
| <img src="https://a.espncdn.com/i/teamlogos/nhl/500/tb.png" style="padding: 0 4px; width: 25px; vertical-align: inherit;">Tampa Bay | 50 | 26 | 106 | 6 |
| <img src="https://a.espncdn.com/i/teamlogos/nhl/500/mtl.png" style="padding: 0 4px; width: 25px; vertical-align: inherit;">Montreal | 48 | 24 | 106 | 10 |
| <img src="https://a.espncdn.com/i/teamlogos/nhl/500/bos.png" style="padding: 0 4px; width: 25px; vertical-align: inherit;">Boston | 45 | 27 | 100 | 10 |
| <img src="https://a.espncdn.com/i/teamlogos/nhl/500/ott.png" style="padding: 0 4px; width: 25px; vertical-align: inherit;">Ottawa | 44 | 27 | 99 | 11 |
| <img src="https://a.espncdn.com/i/teamlogos/nhl/500/det.png" style="padding: 0 4px; width: 25px; vertical-align: inherit;">Detroit | 41 | 31 | 92 | 10 |
| <img src="https://a.espncdn.com/i/teamlogos/nhl/500/fla.png" style="padding: 0 4px; width: 25px; vertical-align: inherit;">Florida | 40 | 38 | 84 | 4 |
| <img src="https://a.espncdn.com/i/teamlogos/nhl/500/tor.png" style="padding: 0 4px; width: 25px; vertical-align: inherit;">Toronto | 32 | 36 | 78 | 14 |