
San Jose Sharks at Detroit Red Wings
· National Hockey League
2 - 4

Larkin's tiebreaking goal in 3rd period sends Red Wings to 4-2 win over Sharks

Marco Kasper scored his first goal in 37 games and added an assist to help Detroit win for the fifth time in six games. Alex DeBrincat scored his team-high 25th goal and J.T. Compher had the other goal for the Red Wings.
Lucas Raymond had three assists and James van Riemsdyk added two. John Gibson made 20 saves.
Will Smith scored for San Jose in his return from an upper-body injury that cost him 13 games. Collin Graf had the other Sharks goal and Macklin Celebrini, the NHL's third-leading scorer with 72 points, added an assist. Celebrini has 32 points in his last 18 games.
Yaroslav Askarov stopped 21 shots for the Sharks, who had won seven of nine.
Detroit converted on its first power play when Raymond set up DeBrincat, who ripped a one-timer from the left circle into the net.
Smith tied it midway through the first period after Celebrini's shot from the high slot tumbled over Gibson and rolled toward the goal line. Smith tucked the puck into the net.
Graf tipped in a pass from Nick Leddy at 1:58 of the second to give the Sharks the lead. Kasper's pass through the legs of a defender set up Compher's goal five minutes later, tying it 2-all.
Larkin jammed the puck between the post and Askarov's pad at 4:41 of the third to give the Red Wings a 3-2 advantage. Kasper ended his scoring drought on an empty-netter with 1:32 remaining.
Red Wings: Host the Ottawa Senators on Sunday.
Regular Season SeriesDET wins series 2-0
Scoring Summary
 |
Goal | 1st Period 6:18 | Alex DeBrincat Goal (25) Snap Shot, assists: Lucas Raymond (36), James van Riemsdyk (8) |
 |
Goal | 1st Period 9:54 | Will Smith Goal (13) Backhand, assists: Macklin Celebrini (48), John Klingberg (8) |
|
Goal | 2nd Period 1:58 | Collin Graf Goal (14) Tip-In, assists: Nick Leddy (4), Sam Dickinson (5) |
|
Goal | 2nd Period 6:55 | J.T. Compher Goal (6) Snap Shot, assists: Marco Kasper (4) |
|
Goal | 3rd Period 4:41 | Dylan Larkin Goal (24) Backhand, assists: Lucas Raymond (37), James van Riemsdyk (9) |
|
Goal | 3rd Period 18:28 | Marco Kasper Goal (4) Wrist Shot, assists: Lucas Raymond (38) |
Statistics
 SJ SJ |
 DET DET |
|
|---|---|---|
| 16 | Blocked Shots | 17 |
| 16 | Hits | 14 |
| 2 | Takeaways | 5 |
| 22 | Shots | 25 |
| 0 | Power Play Goals | 1 |
| 1 | Power Play Opportunities | 2 |
| 0.0 | Power Play Percentage | 50.0 |
| 0 | Short Handed Goals | 0 |
| 0 | Shootout Goals | 0 |
| 23 | Faceoffs Won | 26 |
| 46.9 | Faceoff Win Percent | 53.1 |
| 22 | Giveaways | 11 |
| 2 | Total Penalties | 1 |
| 4 | Penalty Minutes | 2 |
 Detroit Red Wings Injuries
| NAME, POS | STATUS | DATE |
|---|---|---|
| Viktor Arvidsson, LW | Out | Jul 1 |
| Mason Appleton, C | Out | Apr 15 |
| Michael Rasmussen, C | Out | Apr 7 |
 San Jose Sharks Injuries
| NAME, POS | STATUS | DATE |
|---|---|---|
| Ryan Reaves, RW | Out | Apr 10 |
| Logan Couture, C | Injured Reserve | Sep 30 |
Game Information
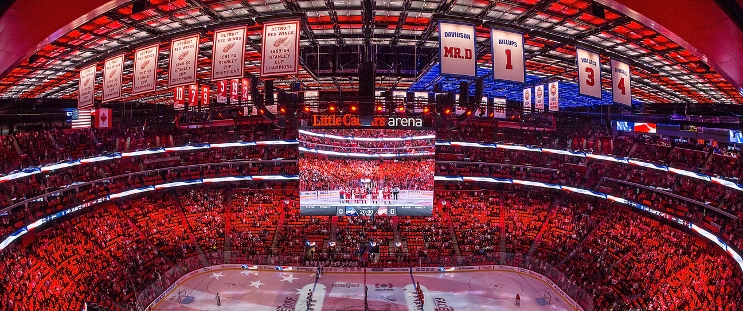 Little Caesars Arena
Location: Detroit, MI
Attendance: 19,515 | Capacity:
Location: Detroit, MI
Attendance: 19,515 | Capacity:
2025-26 Pacific Division Standings
| TEAM | W | L | PTS | OTL |
|---|---|---|---|---|
| <img src="https://a.espncdn.com/i/teamlogos/nhl/500/vgk.png" style="padding: 0 4px; width: 25px; vertical-align: inherit;">Vegas | 39 | 26 | 95 | 17 |
| <img src="https://a.espncdn.com/i/teamlogos/nhl/500/edm.png" style="padding: 0 4px; width: 25px; vertical-align: inherit;">Edmonton | 41 | 30 | 93 | 11 |
| <img src="https://a.espncdn.com/i/teamlogos/nhl/500/ana.png" style="padding: 0 4px; width: 25px; vertical-align: inherit;">Anaheim | 43 | 33 | 92 | 6 |
| <img src="https://a.espncdn.com/i/teamlogos/nhl/500/la.png" style="padding: 0 4px; width: 25px; vertical-align: inherit;">Los Angeles | 35 | 27 | 90 | 20 |
| <img src="https://a.espncdn.com/i/teamlogos/nhl/500/sj.png" style="padding: 0 4px; width: 25px; vertical-align: inherit;">San Jose | 39 | 35 | 86 | 8 |
| <img src="https://a.espncdn.com/i/teamlogos/nhl/500/sea.png" style="padding: 0 4px; width: 25px; vertical-align: inherit;">Seattle | 34 | 37 | 79 | 11 |
| <img src="https://a.espncdn.com/i/teamlogos/nhl/500/cgy.png" style="padding: 0 4px; width: 25px; vertical-align: inherit;">Calgary | 34 | 39 | 77 | 9 |
| <img src="https://a.espncdn.com/i/teamlogos/nhl/500/van.png" style="padding: 0 4px; width: 25px; vertical-align: inherit;">Vancouver | 25 | 49 | 58 | 8 |
2025-26 Atlantic Division Standings
| TEAM | W | L | PTS | OTL |
|---|---|---|---|---|
| <img src="https://a.espncdn.com/i/teamlogos/nhl/500/buf.png" style="padding: 0 4px; width: 25px; vertical-align: inherit;">Buffalo | 50 | 23 | 109 | 9 |
| <img src="https://a.espncdn.com/i/teamlogos/nhl/500/tb.png" style="padding: 0 4px; width: 25px; vertical-align: inherit;">Tampa Bay | 50 | 26 | 106 | 6 |
| <img src="https://a.espncdn.com/i/teamlogos/nhl/500/mtl.png" style="padding: 0 4px; width: 25px; vertical-align: inherit;">Montreal | 48 | 24 | 106 | 10 |
| <img src="https://a.espncdn.com/i/teamlogos/nhl/500/bos.png" style="padding: 0 4px; width: 25px; vertical-align: inherit;">Boston | 45 | 27 | 100 | 10 |
| <img src="https://a.espncdn.com/i/teamlogos/nhl/500/ott.png" style="padding: 0 4px; width: 25px; vertical-align: inherit;">Ottawa | 44 | 27 | 99 | 11 |
| <img src="https://a.espncdn.com/i/teamlogos/nhl/500/det.png" style="padding: 0 4px; width: 25px; vertical-align: inherit;">Detroit | 41 | 31 | 92 | 10 |
| <img src="https://a.espncdn.com/i/teamlogos/nhl/500/fla.png" style="padding: 0 4px; width: 25px; vertical-align: inherit;">Florida | 40 | 38 | 84 | 4 |
| <img src="https://a.espncdn.com/i/teamlogos/nhl/500/tor.png" style="padding: 0 4px; width: 25px; vertical-align: inherit;">Toronto | 32 | 36 | 78 | 14 |