
Toronto Maple Leafs at Winnipeg Jets
· National Hockey League
<span id="gameStatus" class="badge bg-danger" style="font-size: 1.2em; margin: 5px 0;">Final</span>
4 - 3
4 - 3

Max Domi scores in overtime to cap Maple Leafs' rally in 4-3 win over Jets

Domi also had an assist, Matthews scored his 24th goal of the season and Oliver Ekman-Larsson had a goal and two assists. Bobby McMann tied it in the third, and Morgan Rielly added two assists.
Dennis Hildeby stopped 27 shots as Toronto closed a four-game trip 2-1-1.
Alex Iafallo, Kyle Connor and Nino Niederreiter scored Winnipeg, and Connor Hellebuyck made 33 saves. The Jets had won four in a row.
The Jets led 3-1early in the third period. Ekman-Larsson scored at 5:58, and McMann’ tied it with 4:27 remaining.
Jets: At Chicago on Monday night.
Regular Season SeriesTOR wins series 2-0
Scoring Summary
 |
Goal | 2nd Period 2:23 | Alex Iafallo Goal (9) Tip-In, assists: Logan Stanley (8), Vladislav Namestnikov (4) |
|
Goal | 2nd Period 8:59 | Kyle Connor Goal (23) Snap Shot, assists: Gabriel Vilardi (25) |
 |
Goal | 2nd Period 9:22 | Auston Matthews Goal (24) Wrist Shot, assists: Max Domi (16), Morgan Rielly (22) |
|
Goal | 3rd Period 2:28 | Nino Niederreiter Goal (7) Tip-In, assists: Vladislav Namestnikov (5), Luke Schenn (5) |
|
Goal | 3rd Period 5:58 | Oliver Ekman-Larsson Goal (8) Slap Shot, assists: Nicholas Robertson (13), Easton Cowan (8) |
|
Goal | 3rd Period 15:33 | Bobby McMann Goal (15) Tip-In, assists: Oliver Ekman-Larsson (22), Morgan Rielly (23) |
|
Goal | 4th Period 3:08 | Max Domi Goal (6) Wrist Shot, assists: Auston Matthews (16), Oliver Ekman-Larsson (23) |
Statistics
 TOR TOR |
 WPG WPG |
|
|---|---|---|
| 11 | Blocked Shots | 11 |
| 21 | Hits | 17 |
| 5 | Takeaways | 2 |
| 37 | Shots | 30 |
| 0 | Power Play Goals | 0 |
| 2 | Power Play Opportunities | 3 |
| 0.0 | Power Play Percentage | 0.0 |
| 0 | Short Handed Goals | 0 |
| 0 | Shootout Goals | 0 |
| 30 | Faceoffs Won | 19 |
| 61.2 | Faceoff Win Percent | 38.8 |
| 23 | Giveaways | 13 |
| 3 | Total Penalties | 2 |
| 6 | Penalty Minutes | 4 |
 Winnipeg Jets Injuries
| NAME, POS | STATUS | DATE |
|---|---|---|
| Elias Salomonsson, D | Out | Apr 30 |
| Neal Pionk, D | Out | Apr 16 |
| Vladislav Namestnikov, C | Out | Apr 16 |
| Gustav Nyquist, RW | Out | Apr 16 |
| Alex Iafallo, LW | Out | Apr 16 |
 Toronto Maple Leafs Injuries
| NAME, POS | STATUS | DATE |
|---|---|---|
| Zack MacEwen, C | Injured Reserve | Jul 1 |
| Max Domi, C | Out | May 25 |
| Calle Jarnkrok, C | Out | Apr 15 |
| Dakota Joshua, C | Out | Apr 11 |
| Auston Matthews, C | Out | Mar 19 |
Game Information
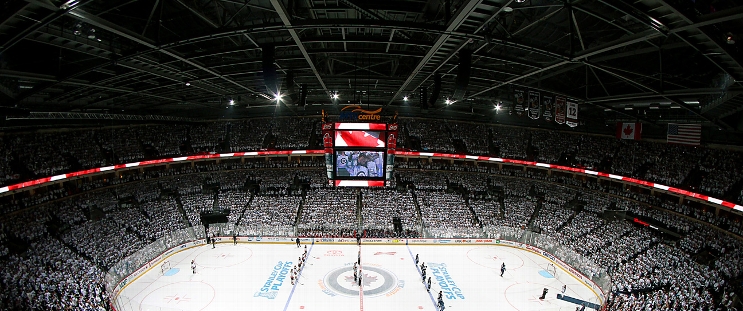 Canada Life Centre
Location: Winnipeg,
Attendance: 15,225 | Capacity:
Canada Life Centre
Location: Winnipeg,
Attendance: 15,225 | Capacity:
2025-26 Atlantic Division Standings
| TEAM | W | L | PTS | OTL |
|---|---|---|---|---|
| <img src="https://a.espncdn.com/i/teamlogos/nhl/500/buf.png" style="padding: 0 4px; width: 25px; vertical-align: inherit;">Buffalo | 50 | 23 | 109 | 9 |
| <img src="https://a.espncdn.com/i/teamlogos/nhl/500/tb.png" style="padding: 0 4px; width: 25px; vertical-align: inherit;">Tampa Bay | 50 | 26 | 106 | 6 |
| <img src="https://a.espncdn.com/i/teamlogos/nhl/500/mtl.png" style="padding: 0 4px; width: 25px; vertical-align: inherit;">Montreal | 48 | 24 | 106 | 10 |
| <img src="https://a.espncdn.com/i/teamlogos/nhl/500/bos.png" style="padding: 0 4px; width: 25px; vertical-align: inherit;">Boston | 45 | 27 | 100 | 10 |
| <img src="https://a.espncdn.com/i/teamlogos/nhl/500/ott.png" style="padding: 0 4px; width: 25px; vertical-align: inherit;">Ottawa | 44 | 27 | 99 | 11 |
| <img src="https://a.espncdn.com/i/teamlogos/nhl/500/det.png" style="padding: 0 4px; width: 25px; vertical-align: inherit;">Detroit | 41 | 31 | 92 | 10 |
| <img src="https://a.espncdn.com/i/teamlogos/nhl/500/fla.png" style="padding: 0 4px; width: 25px; vertical-align: inherit;">Florida | 40 | 38 | 84 | 4 |
| <img src="https://a.espncdn.com/i/teamlogos/nhl/500/tor.png" style="padding: 0 4px; width: 25px; vertical-align: inherit;">Toronto | 32 | 36 | 78 | 14 |
2025-26 Central Division Standings
| TEAM | W | L | PTS | OTL |
|---|---|---|---|---|
| <img src="https://a.espncdn.com/i/teamlogos/nhl/500/col.png" style="padding: 0 4px; width: 25px; vertical-align: inherit;">Colorado | 55 | 16 | 121 | 11 |
| <img src="https://a.espncdn.com/i/teamlogos/nhl/500/dal.png" style="padding: 0 4px; width: 25px; vertical-align: inherit;">Dallas | 50 | 20 | 112 | 12 |
| <img src="https://a.espncdn.com/i/teamlogos/nhl/500/min.png" style="padding: 0 4px; width: 25px; vertical-align: inherit;">Minnesota | 46 | 24 | 104 | 12 |
| <img src="https://a.espncdn.com/i/teamlogos/nhl/500/uta.png" style="padding: 0 4px; width: 25px; vertical-align: inherit;">Utah | 43 | 33 | 92 | 6 |
| <img src="https://a.espncdn.com/i/teamlogos/nhl/500/stl.png" style="padding: 0 4px; width: 25px; vertical-align: inherit;">St. Louis | 37 | 33 | 86 | 12 |
| <img src="https://a.espncdn.com/i/teamlogos/nhl/500/nsh.png" style="padding: 0 4px; width: 25px; vertical-align: inherit;">Nashville | 38 | 34 | 86 | 10 |
| <img src="https://a.espncdn.com/i/teamlogos/nhl/500/wpg.png" style="padding: 0 4px; width: 25px; vertical-align: inherit;">Winnipeg | 35 | 35 | 82 | 12 |
| <img src="https://a.espncdn.com/i/teamlogos/nhl/500/chi.png" style="padding: 0 4px; width: 25px; vertical-align: inherit;">Chicago | 29 | 39 | 72 | 14 |