
Tampa Bay Lightning at Dallas Stars
· National Hockey League
4 - 1

Hagel scores 6th winning goal, Vasilevskiy stops 19 shots to lead Lightning past Stars 4-1

Rookie Dominic James and Jake Guentzel each had a goal and an assist, and Pontus Holmberg added a late empty-net score for the Lightning, who bounced back from a shootout loss at St. Louis on Friday that ended a franchise record-tying 11-game winning streak. Tampa Bay has a 13-game points streak and they are tied with Carolina atop of the Eastern Conference with 64 points, second overall to Colorado (74).
Hagel took a pass at the goal line to the left side of Dallas goaltender Jake Oettinger, playing off the line, and muscled the puck through the stick of Stars defenseman Esa Lindell for a 2-1 lead. It was Hagel’s sixth winning goal this season, tied for second in the NHL behind Nashville’s Steven Stamkos, who has seven.
Tampa Bay is a league-best 18-4-4 on the road and 20-1-0 when leading after two periods.
Vasilevskiy (20-7-3) has 10 straight 20-win seasons and is 17-4-3 in his career against Dallas.
Oskar Back scored for the struggling Stars, who came off a 2-3-1 road trip and have lost three straight in regulation, scoring one goal in each game. Oettinger, tied for eighth in the NHL with 17 wins, stopped 22 shots and is 1-4-2 in his last seven starts.
Dallas, tied with Minnesota for second overall in the West with 63 points, lost for the fifth time in regulation in 25 games when scoring first.
Back opened the scoring four minutes in and four minutes later James evened the score. Two of James’ four goals this season have been scored in the last seven games.
Stars: Host Boston on Tuesday.
Regular Season SeriesTB wins series 2-0
Scoring Summary
 |
Goal | 1st Period 4:00 | Oskar Bäck Goal (4) Snap Shot, assists: Nils Lundkvist (4), Mavrik Bourque (9) |
 |
Goal | 1st Period 8:04 | Dominic James Goal (4) Snap Shot, assists: Jake Guentzel (28), Charle-Edouard D'Astous (14) |
|
Goal | 2nd Period 11:04 | Brandon Hagel Goal (23) Wrist Shot, assists: Nikita Kucherov (46), Darren Raddysh (30) |
|
Goal | 2nd Period 18:50 | Jake Guentzel Goal (21) Backhand, assists: Dominic James (6), Oliver Bjorkstrand (16) |
|
Goal | 3rd Period 17:59 | Pontus Holmberg Goal (8) Snap Shot, assists: Yanni Gourde (12), J.J. Moser (11) |
Statistics
 TB TB |
 DAL DAL |
|
|---|---|---|
| 14 | Blocked Shots | 14 |
| 21 | Hits | 16 |
| 6 | Takeaways | 3 |
| 26 | Shots | 20 |
| 0 | Power Play Goals | 0 |
| 2 | Power Play Opportunities | 2 |
| 0.0 | Power Play Percentage | 0.0 |
| 0 | Short Handed Goals | 0 |
| 0 | Shootout Goals | 0 |
| 19 | Faceoffs Won | 29 |
| 39.6 | Faceoff Win Percent | 60.4 |
| 17 | Giveaways | 13 |
| 3 | Total Penalties | 3 |
| 6 | Penalty Minutes | 6 |
 Dallas Stars Injuries
| NAME, POS | STATUS | DATE |
|---|---|---|
| Arttu Hyry, RW | Out | Jul 1 |
| Roope Hintz, C | Out | May 4 |
| Tyler Seguin, C | Injured Reserve | May 4 |
| Nils Lundkvist, D | Out | Apr 29 |
 Tampa Bay Lightning Injuries
| NAME, POS | STATUS | DATE |
|---|---|---|
| Pontus Holmberg, RW | Out | May 5 |
Game Information
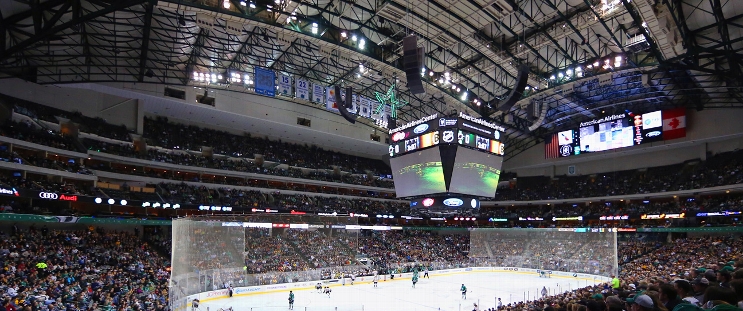 American Airlines Center
Location: Dallas, TX
Attendance: 18,532 | Capacity:
Location: Dallas, TX
Attendance: 18,532 | Capacity:
2025-26 Atlantic Division Standings
| TEAM | W | L | PTS | OTL |
|---|---|---|---|---|
| <img src="https://a.espncdn.com/i/teamlogos/nhl/500/buf.png" style="padding: 0 4px; width: 25px; vertical-align: inherit;">Buffalo | 50 | 23 | 109 | 9 |
| <img src="https://a.espncdn.com/i/teamlogos/nhl/500/tb.png" style="padding: 0 4px; width: 25px; vertical-align: inherit;">Tampa Bay | 50 | 26 | 106 | 6 |
| <img src="https://a.espncdn.com/i/teamlogos/nhl/500/mtl.png" style="padding: 0 4px; width: 25px; vertical-align: inherit;">Montreal | 48 | 24 | 106 | 10 |
| <img src="https://a.espncdn.com/i/teamlogos/nhl/500/bos.png" style="padding: 0 4px; width: 25px; vertical-align: inherit;">Boston | 45 | 27 | 100 | 10 |
| <img src="https://a.espncdn.com/i/teamlogos/nhl/500/ott.png" style="padding: 0 4px; width: 25px; vertical-align: inherit;">Ottawa | 44 | 27 | 99 | 11 |
| <img src="https://a.espncdn.com/i/teamlogos/nhl/500/det.png" style="padding: 0 4px; width: 25px; vertical-align: inherit;">Detroit | 41 | 31 | 92 | 10 |
| <img src="https://a.espncdn.com/i/teamlogos/nhl/500/fla.png" style="padding: 0 4px; width: 25px; vertical-align: inherit;">Florida | 40 | 38 | 84 | 4 |
| <img src="https://a.espncdn.com/i/teamlogos/nhl/500/tor.png" style="padding: 0 4px; width: 25px; vertical-align: inherit;">Toronto | 32 | 36 | 78 | 14 |
2025-26 Central Division Standings
| TEAM | W | L | PTS | OTL |
|---|---|---|---|---|
| <img src="https://a.espncdn.com/i/teamlogos/nhl/500/col.png" style="padding: 0 4px; width: 25px; vertical-align: inherit;">Colorado | 55 | 16 | 121 | 11 |
| <img src="https://a.espncdn.com/i/teamlogos/nhl/500/dal.png" style="padding: 0 4px; width: 25px; vertical-align: inherit;">Dallas | 50 | 20 | 112 | 12 |
| <img src="https://a.espncdn.com/i/teamlogos/nhl/500/min.png" style="padding: 0 4px; width: 25px; vertical-align: inherit;">Minnesota | 46 | 24 | 104 | 12 |
| <img src="https://a.espncdn.com/i/teamlogos/nhl/500/uta.png" style="padding: 0 4px; width: 25px; vertical-align: inherit;">Utah | 43 | 33 | 92 | 6 |
| <img src="https://a.espncdn.com/i/teamlogos/nhl/500/stl.png" style="padding: 0 4px; width: 25px; vertical-align: inherit;">St. Louis | 37 | 33 | 86 | 12 |
| <img src="https://a.espncdn.com/i/teamlogos/nhl/500/nsh.png" style="padding: 0 4px; width: 25px; vertical-align: inherit;">Nashville | 38 | 34 | 86 | 10 |
| <img src="https://a.espncdn.com/i/teamlogos/nhl/500/wpg.png" style="padding: 0 4px; width: 25px; vertical-align: inherit;">Winnipeg | 35 | 35 | 82 | 12 |
| <img src="https://a.espncdn.com/i/teamlogos/nhl/500/chi.png" style="padding: 0 4px; width: 25px; vertical-align: inherit;">Chicago | 29 | 39 | 72 | 14 |