
Ottawa Senators at Columbus Blue Jackets
· National Hockey League
4 - 1

Kleven, Stutzle score early as Senators beat Blue Jackets 4-1

Ridly Greig had a goal and assist, Thomas Chabot added two assists, and Stutzle also had an assist. James Reimer made 21 saves in his first win for the Senators, who had lost two straight. He signed with the team as a free agent on Jan. 12.
Sean Monahan scored for the Blue Jackets. Elvis Merzlikins stopped five shots for Columbus in 20 minutes before leaving the game with an illness. He was replaced in the second period by Jet Greaves, who stopped 12 shots.
Kleven put Ottawa ahead 1-0 at 3:34 of the first period, beating Merzlikins from the left circle on the Senators’ second shot of the game.
Monahan pulled Columbus even at 7:46 with his first goal in seven games, but Stutzle put Ottawa back in front 2:29 later.
After a scoreless second period, Greig gave Ottawa an insurance goal off the rush at 6:49 of the third. Brady Tkachuk added an empty-netter with 3:06 remaining.
Blue Jackets host Dallas on Thursday.
Regular Season SeriesOTT wins series 2-1
Scoring Summary
 |
Goal | 1st Period 3:34 | Tyler Kleven Goal (1) Snap Shot, assists: Claude Giroux (26), Michael Amadio (11) |
 |
Goal | 1st Period 7:46 | Sean Monahan Goal (7) Snap Shot, assists: Boone Jenner (17), Kent Johnson (10) |
|
Goal | 1st Period 10:15 | Tim Stützle Goal (22) Wrist Shot, assists: Thomas Chabot (13), Nick Jensen (10) |
|
Goal | 3rd Period 6:49 | Ridly Greig Goal (7) Backhand, assists: Dylan Cozens (22), Thomas Chabot (14) |
|
Goal | 3rd Period 16:54 | Brady Tkachuk Goal (11) Wrist Shot, assists: Tim Stützle (29), Ridly Greig (15) |
Statistics
 OTT OTT |
 CBJ CBJ |
|
|---|---|---|
| 14 | Blocked Shots | 13 |
| 15 | Hits | 27 |
| 6 | Takeaways | 3 |
| 21 | Shots | 22 |
| 0 | Power Play Goals | 0 |
| 3 | Power Play Opportunities | 3 |
| 0.0 | Power Play Percentage | 0.0 |
| 0 | Short Handed Goals | 0 |
| 0 | Shootout Goals | 0 |
| 31 | Faceoffs Won | 21 |
| 59.6 | Faceoff Win Percent | 40.4 |
| 16 | Giveaways | 19 |
| 4 | Total Penalties | 4 |
| 8 | Penalty Minutes | 8 |
 Columbus Blue Jackets Injuries
| NAME, POS | STATUS | DATE |
|---|
 Ottawa Senators Injuries
| NAME, POS | STATUS | DATE |
|---|---|---|
| Ridly Greig, C | Suspension | May 4 |
| Artem Zub, D | Out | Apr 27 |
| Jake Sanderson, D | Out | Apr 24 |
Game Information
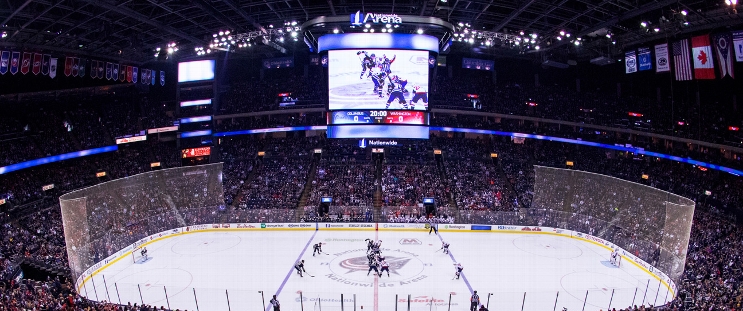 Nationwide Arena
Location: Columbus, OH
Attendance: 13,278 | Capacity:
Location: Columbus, OH
Attendance: 13,278 | Capacity:
2025-26 Atlantic Division Standings
| TEAM | W | L | PTS | OTL |
|---|---|---|---|---|
| <img src="https://a.espncdn.com/i/teamlogos/nhl/500/buf.png" style="padding: 0 4px; width: 25px; vertical-align: inherit;">Buffalo | 50 | 23 | 109 | 9 |
| <img src="https://a.espncdn.com/i/teamlogos/nhl/500/tb.png" style="padding: 0 4px; width: 25px; vertical-align: inherit;">Tampa Bay | 50 | 26 | 106 | 6 |
| <img src="https://a.espncdn.com/i/teamlogos/nhl/500/mtl.png" style="padding: 0 4px; width: 25px; vertical-align: inherit;">Montreal | 48 | 24 | 106 | 10 |
| <img src="https://a.espncdn.com/i/teamlogos/nhl/500/bos.png" style="padding: 0 4px; width: 25px; vertical-align: inherit;">Boston | 45 | 27 | 100 | 10 |
| <img src="https://a.espncdn.com/i/teamlogos/nhl/500/ott.png" style="padding: 0 4px; width: 25px; vertical-align: inherit;">Ottawa | 44 | 27 | 99 | 11 |
| <img src="https://a.espncdn.com/i/teamlogos/nhl/500/det.png" style="padding: 0 4px; width: 25px; vertical-align: inherit;">Detroit | 41 | 31 | 92 | 10 |
| <img src="https://a.espncdn.com/i/teamlogos/nhl/500/fla.png" style="padding: 0 4px; width: 25px; vertical-align: inherit;">Florida | 40 | 38 | 84 | 4 |
| <img src="https://a.espncdn.com/i/teamlogos/nhl/500/tor.png" style="padding: 0 4px; width: 25px; vertical-align: inherit;">Toronto | 32 | 36 | 78 | 14 |
2025-26 Metropolitan Division Standings
| TEAM | W | L | PTS | OTL |
|---|---|---|---|---|
| <img src="https://a.espncdn.com/i/teamlogos/nhl/500/car.png" style="padding: 0 4px; width: 25px; vertical-align: inherit;">Carolina | 53 | 22 | 113 | 7 |
| <img src="https://a.espncdn.com/i/teamlogos/nhl/500/pit.png" style="padding: 0 4px; width: 25px; vertical-align: inherit;">Pittsburgh | 41 | 25 | 98 | 16 |
| <img src="https://a.espncdn.com/i/teamlogos/nhl/500/phi.png" style="padding: 0 4px; width: 25px; vertical-align: inherit;">Philadelphia | 43 | 27 | 98 | 12 |
| <img src="https://a.espncdn.com/i/teamlogos/nhl/500/wsh.png" style="padding: 0 4px; width: 25px; vertical-align: inherit;">Washington | 43 | 30 | 95 | 9 |
| <img src="https://a.espncdn.com/i/teamlogos/nhl/500/cbj.png" style="padding: 0 4px; width: 25px; vertical-align: inherit;">Columbus | 40 | 30 | 92 | 12 |
| <img src="https://a.espncdn.com/i/teamlogos/nhl/500/nyi.png" style="padding: 0 4px; width: 25px; vertical-align: inherit;">NY Islanders | 43 | 34 | 91 | 5 |
| <img src="https://a.espncdn.com/i/teamlogos/nhl/500/nj.png" style="padding: 0 4px; width: 25px; vertical-align: inherit;">New Jersey | 42 | 37 | 87 | 3 |
| <img src="https://a.espncdn.com/i/teamlogos/nhl/500/nyr.png" style="padding: 0 4px; width: 25px; vertical-align: inherit;">NY Rangers | 34 | 39 | 77 | 9 |