
Dallas Stars at Columbus Blue Jackets
· National Hockey League
0 - 1

Jet Greaves makes 28 saves, Zach Werenski scores to lead Blue Jackets to 1-0 win over Stars

Werenski scored at 8:48 of the first period with a wrist shot from the right circle that went through traffic and inside the far post with assists from Damon Severson and Isac Lundestrom, who had missed 12 games with a lower-body injury suffered in practice on Dec. 27.
The Blue Jackets have now won five of their last six.
Casey DeSmith stopped 21 of the 22 shots he faced but could not prevent the Stars from losing for the fourth time in their last five games. The Stars outshot the Blue Jackets 28-22.
Blue Jackets forward Charlie Coyle played in his 1,000th career game, the fifth player to reach the mark in a Columbus uniform. He scored into an empty net late in the game but the goal was disallowed for offside.
The former first-round draft pick of the San Jose Sharks has 199 goals and 316 assists in his career with Minnesota, Boston, Colorado and Columbus.
Mason Marchment returned to the Blue Jackets lineup after missing eight games with an upper-body injury suffered Jan. 4 against Pittsburgh.
Blue Jackets: Host Tampa Bay on Saturday night in the third game of a five-game homestand.
Regular Season SeriesCBJ win series 2-0
Scoring Summary
 |
Goal | 1st Period 8:48 | Zach Werenski Goal (19) Snap Shot, assists: Damon Severson (16), Isac Lundeström (5) |
Statistics
 DAL DAL |
 CBJ CBJ |
|
|---|---|---|
| 10 | Blocked Shots | 17 |
| 7 | Hits | 35 |
| 5 | Takeaways | 4 |
| 28 | Shots | 22 |
| 0 | Power Play Goals | 0 |
| 2 | Power Play Opportunities | 1 |
| 0.0 | Power Play Percentage | 0.0 |
| 0 | Short Handed Goals | 0 |
| 0 | Shootout Goals | 0 |
| 26 | Faceoffs Won | 27 |
| 49.1 | Faceoff Win Percent | 50.9 |
| 14 | Giveaways | 14 |
| 1 | Total Penalties | 2 |
| 2 | Penalty Minutes | 4 |
 Columbus Blue Jackets Injuries
| NAME, POS | STATUS | DATE |
|---|
 Dallas Stars Injuries
| NAME, POS | STATUS | DATE |
|---|---|---|
| Arttu Hyry, RW | Out | Jul 1 |
| Roope Hintz, C | Out | May 4 |
| Tyler Seguin, C | Injured Reserve | May 4 |
| Nils Lundkvist, D | Out | Apr 29 |
Game Information
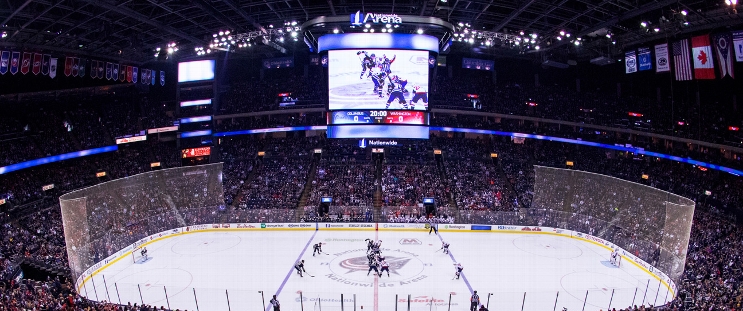 Nationwide Arena
Location: Columbus, OH
Attendance: 14,372 | Capacity:
Location: Columbus, OH
Attendance: 14,372 | Capacity:
2025-26 Central Division Standings
| TEAM | W | L | PTS | OTL |
|---|---|---|---|---|
| <img src="https://a.espncdn.com/i/teamlogos/nhl/500/col.png" style="padding: 0 4px; width: 25px; vertical-align: inherit;">Colorado | 55 | 16 | 121 | 11 |
| <img src="https://a.espncdn.com/i/teamlogos/nhl/500/dal.png" style="padding: 0 4px; width: 25px; vertical-align: inherit;">Dallas | 50 | 20 | 112 | 12 |
| <img src="https://a.espncdn.com/i/teamlogos/nhl/500/min.png" style="padding: 0 4px; width: 25px; vertical-align: inherit;">Minnesota | 46 | 24 | 104 | 12 |
| <img src="https://a.espncdn.com/i/teamlogos/nhl/500/uta.png" style="padding: 0 4px; width: 25px; vertical-align: inherit;">Utah | 43 | 33 | 92 | 6 |
| <img src="https://a.espncdn.com/i/teamlogos/nhl/500/stl.png" style="padding: 0 4px; width: 25px; vertical-align: inherit;">St. Louis | 37 | 33 | 86 | 12 |
| <img src="https://a.espncdn.com/i/teamlogos/nhl/500/nsh.png" style="padding: 0 4px; width: 25px; vertical-align: inherit;">Nashville | 38 | 34 | 86 | 10 |
| <img src="https://a.espncdn.com/i/teamlogos/nhl/500/wpg.png" style="padding: 0 4px; width: 25px; vertical-align: inherit;">Winnipeg | 35 | 35 | 82 | 12 |
| <img src="https://a.espncdn.com/i/teamlogos/nhl/500/chi.png" style="padding: 0 4px; width: 25px; vertical-align: inherit;">Chicago | 29 | 39 | 72 | 14 |
2025-26 Metropolitan Division Standings
| TEAM | W | L | PTS | OTL |
|---|---|---|---|---|
| <img src="https://a.espncdn.com/i/teamlogos/nhl/500/car.png" style="padding: 0 4px; width: 25px; vertical-align: inherit;">Carolina | 53 | 22 | 113 | 7 |
| <img src="https://a.espncdn.com/i/teamlogos/nhl/500/pit.png" style="padding: 0 4px; width: 25px; vertical-align: inherit;">Pittsburgh | 41 | 25 | 98 | 16 |
| <img src="https://a.espncdn.com/i/teamlogos/nhl/500/phi.png" style="padding: 0 4px; width: 25px; vertical-align: inherit;">Philadelphia | 43 | 27 | 98 | 12 |
| <img src="https://a.espncdn.com/i/teamlogos/nhl/500/wsh.png" style="padding: 0 4px; width: 25px; vertical-align: inherit;">Washington | 43 | 30 | 95 | 9 |
| <img src="https://a.espncdn.com/i/teamlogos/nhl/500/cbj.png" style="padding: 0 4px; width: 25px; vertical-align: inherit;">Columbus | 40 | 30 | 92 | 12 |
| <img src="https://a.espncdn.com/i/teamlogos/nhl/500/nyi.png" style="padding: 0 4px; width: 25px; vertical-align: inherit;">NY Islanders | 43 | 34 | 91 | 5 |
| <img src="https://a.espncdn.com/i/teamlogos/nhl/500/nj.png" style="padding: 0 4px; width: 25px; vertical-align: inherit;">New Jersey | 42 | 37 | 87 | 3 |
| <img src="https://a.espncdn.com/i/teamlogos/nhl/500/nyr.png" style="padding: 0 4px; width: 25px; vertical-align: inherit;">NY Rangers | 34 | 39 | 77 | 9 |