
Los Angeles Kings at Detroit Red Wings
· National Hockey League
3 - 1

Detroit's Patrick Kane ties Modano for American-born NHL points mark in 3-1 loss to Kings

Kane matched Modano by recording his 1,374th point Alex DeBrincat late in the third period. He accomplished the feat just a couple of months after turning 37, while Modano was 40 when he scored a goal to register point No. 1,374. For his career, Kane has 500 goals and 874 assists in 1,341 NHL regular-season games. Modano retired in 2011 with 561 goals and 813 assists in 1,499 games.
Samuel Helenius, Andrei Kuzmenko and Corey Perry scored for the Kings, who won their third straight game.
Detroit's John Gibson made 19 saves and had his eight-game win streak halted, surrendering a goal midway through the second period and a power-play score early in the third.
The Kings have earned points in their last six games (3-0-3). The Red Wings lost for just the second time in six games and third time in their last 11.
Helenius got Los Angeles on the board at the 10-minute mark of the second period, scoring his second of the season by converting a feed from Jeff Malott from behind the net.
Kuzmenko extended the lead to 2-0 for the Kings at 6:46 of the third period, scoring on the power play on assists from Adrian Kempe and Kevin Fiala. The goal was the 24th of the season with a man advantage for the Kings, who rank last in the NHL on the power play.
DeBrincat scored and pulled Detroit within 2-1 at 17:45 of the third period after the Red Wings pulled Gibson for the extra skater. Kane and Moritz Seider assisted.
The Kings iced the game when Perry scored into an empty net at 18:47.
Red Wings: Host the Washington Capitals on Thursday.
Regular Season SeriesSeries tied 1-1
Scoring Summary
 |
Goal | 2nd Period 10:00 | Samuel Helenius Goal (2) Snap Shot, assists: Jeff Malott (4) |
|
Goal | 3rd Period 6:46 | Andrei Kuzmenko Goal (11) Snap Shot, assists: Adrian Kempe (23), Kevin Fiala (19) |
 |
Goal | 3rd Period 17:45 | Alex DeBrincat Goal (28) Wrist Shot, assists: Moritz Seider (29), Patrick Kane (23) |
|
Goal | 3rd Period 18:47 | Corey Perry Goal (11) Wrist Shot, assists: Alex Laferriere (12) |
Statistics
 LA LA |
 DET DET |
|
|---|---|---|
| 16 | Blocked Shots | 15 |
| 21 | Hits | 11 |
| 5 | Takeaways | 6 |
| 22 | Shots | 28 |
| 1 | Power Play Goals | 0 |
| 3 | Power Play Opportunities | 4 |
| 33.3 | Power Play Percentage | 0.0 |
| 0 | Short Handed Goals | 0 |
| 0 | Shootout Goals | 0 |
| 17 | Faceoffs Won | 37 |
| 31.5 | Faceoff Win Percent | 68.5 |
| 20 | Giveaways | 15 |
| 4 | Total Penalties | 3 |
| 8 | Penalty Minutes | 6 |
 Detroit Red Wings Injuries
| NAME, POS | STATUS | DATE |
|---|---|---|
| Viktor Arvidsson, LW | Out | Jul 1 |
| Mason Appleton, C | Out | Apr 15 |
| Michael Rasmussen, C | Out | Apr 7 |
 Los Angeles Kings Injuries
| NAME, POS | STATUS | DATE |
|---|---|---|
| Kevin Fiala, LW | Injured Reserve | Mar 6 |
Game Information
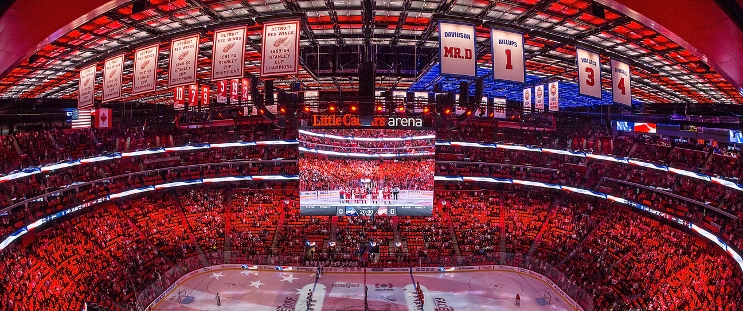 Little Caesars Arena
Location: Detroit, MI
Attendance: 19,515 | Capacity:
Location: Detroit, MI
Attendance: 19,515 | Capacity:
2025-26 Pacific Division Standings
| TEAM | W | L | PTS | OTL |
|---|---|---|---|---|
| <img src="https://a.espncdn.com/i/teamlogos/nhl/500/vgk.png" style="padding: 0 4px; width: 25px; vertical-align: inherit;">Vegas | 39 | 26 | 95 | 17 |
| <img src="https://a.espncdn.com/i/teamlogos/nhl/500/edm.png" style="padding: 0 4px; width: 25px; vertical-align: inherit;">Edmonton | 41 | 30 | 93 | 11 |
| <img src="https://a.espncdn.com/i/teamlogos/nhl/500/ana.png" style="padding: 0 4px; width: 25px; vertical-align: inherit;">Anaheim | 43 | 33 | 92 | 6 |
| <img src="https://a.espncdn.com/i/teamlogos/nhl/500/la.png" style="padding: 0 4px; width: 25px; vertical-align: inherit;">Los Angeles | 35 | 27 | 90 | 20 |
| <img src="https://a.espncdn.com/i/teamlogos/nhl/500/sj.png" style="padding: 0 4px; width: 25px; vertical-align: inherit;">San Jose | 39 | 35 | 86 | 8 |
| <img src="https://a.espncdn.com/i/teamlogos/nhl/500/sea.png" style="padding: 0 4px; width: 25px; vertical-align: inherit;">Seattle | 34 | 37 | 79 | 11 |
| <img src="https://a.espncdn.com/i/teamlogos/nhl/500/cgy.png" style="padding: 0 4px; width: 25px; vertical-align: inherit;">Calgary | 34 | 39 | 77 | 9 |
| <img src="https://a.espncdn.com/i/teamlogos/nhl/500/van.png" style="padding: 0 4px; width: 25px; vertical-align: inherit;">Vancouver | 25 | 49 | 58 | 8 |
2025-26 Atlantic Division Standings
| TEAM | W | L | PTS | OTL |
|---|---|---|---|---|
| <img src="https://a.espncdn.com/i/teamlogos/nhl/500/buf.png" style="padding: 0 4px; width: 25px; vertical-align: inherit;">Buffalo | 50 | 23 | 109 | 9 |
| <img src="https://a.espncdn.com/i/teamlogos/nhl/500/tb.png" style="padding: 0 4px; width: 25px; vertical-align: inherit;">Tampa Bay | 50 | 26 | 106 | 6 |
| <img src="https://a.espncdn.com/i/teamlogos/nhl/500/mtl.png" style="padding: 0 4px; width: 25px; vertical-align: inherit;">Montreal | 48 | 24 | 106 | 10 |
| <img src="https://a.espncdn.com/i/teamlogos/nhl/500/bos.png" style="padding: 0 4px; width: 25px; vertical-align: inherit;">Boston | 45 | 27 | 100 | 10 |
| <img src="https://a.espncdn.com/i/teamlogos/nhl/500/ott.png" style="padding: 0 4px; width: 25px; vertical-align: inherit;">Ottawa | 44 | 27 | 99 | 11 |
| <img src="https://a.espncdn.com/i/teamlogos/nhl/500/det.png" style="padding: 0 4px; width: 25px; vertical-align: inherit;">Detroit | 41 | 31 | 92 | 10 |
| <img src="https://a.espncdn.com/i/teamlogos/nhl/500/fla.png" style="padding: 0 4px; width: 25px; vertical-align: inherit;">Florida | 40 | 38 | 84 | 4 |
| <img src="https://a.espncdn.com/i/teamlogos/nhl/500/tor.png" style="padding: 0 4px; width: 25px; vertical-align: inherit;">Toronto | 32 | 36 | 78 | 14 |