
Boston Bruins at Florida Panthers
· National Hockey League
4 - 5

Marchand scores in shootout, Panthers beat Bruins, his former team, 5-4

Anton Lundell had a goal and two assists for his second three-point game of the season, while Matthew Tkachuk and Uvis Balinskis had a goal and an assist each as the Panthers ended a four-game losing streak. Sergei Bobrovsky made 25 saves.
Michael Eyssimont scored twice for the Bruins, who have lost two straight games in Florida in a shootout, including Sunday’s NHL Stadium Series game Tampa Bay Lightning.
Mark Kastelic and Casey Mittelstadt also had goals and Joonas Korpisalo had 22 saves.
The Panthers trailed 2-1 after the first period despite taking the lead on a goal from Eetu Luostarinen at 4:22.
Eyssimont scored a pair of goals on breakaways — including one when he came racing out of the penalty box and got Bobrovsky to go down, leaving the net open enough for him to be able to tuck the puck in.
Florida scored three goals on special teams in the second, two on the power play and one short-handed.
Balinskis tied the score 30 seconds into the period. Tkachuk made it 3-2 at 2:22 on a power-play goal and the Panthers made it 4-2 with 1:27 remaining in the second, Sam Reinhart feeding Lundell off the rush while Florida was killing off a penalty.
Boston pulled within one at 4-3 in third on Kastelic's goal and tied it when Mittelstadt collected a rebound off a David Pastrnak shot and lifted the puck over Bobrovsky with 9:30 remaining while on the power play.
Boston went 1 for 7 on the power play.
Panthers: Visit Tampa Bay on Thursday night.
Regular Season SeriesFLA leads series 2-0
Scoring Summary
 |
Goal | 1st Period 4:22 | Eetu Luostarinen Goal (7) Wrist Shot, assists: none |
 |
Goal | 1st Period 7:18 | Michael Eyssimont Goal (7) Wrist Shot, assists: Alex Steeves (7), Hampus Lindholm (14) |
|
Goal | 1st Period 12:43 | Michael Eyssimont Goal (8) Wrist Shot, assists: Marat Khusnutdinov (14), Andrew Peeke (8) |
|
Goal | 2nd Period 0:30 | Uvis Balinskis Goal (5) Snap Shot, assists: Matthew Tkachuk (5), Anton Lundell (22) |
|
Goal | 2nd Period 2:47 | Matthew Tkachuk Goal (3) Backhand, assists: Anton Lundell (23), Uvis Balinskis (9) |
|
Goal | 2nd Period 18:33 | Anton Lundell Goal (16) Tip-In, assists: Sam Reinhart (28) |
|
Goal | 3rd Period 7:52 | Mark Kastelic Goal (9) Deflected, assists: Charlie McAvoy (35), Hampus Lindholm (15) |
|
Goal | 3rd Period 10:30 | Casey Mittelstadt Goal (12) Wrist Shot, assists: David Pastrnak (49), Morgan Geekie (22) |
|
Goal | 5 0:00 | Anton Lundell Goal Backhand |
|
Goal | 5 0:00 | Viktor Arvidsson Goal Backhand |
|
Goal | 5 0:00 | Brad Marchand Goal Backhand |
Statistics
 BOS BOS |
 FLA FLA |
|
|---|---|---|
| 12 | Blocked Shots | 20 |
| 24 | Hits | 26 |
| 4 | Takeaways | 4 |
| 29 | Shots | 26 |
| 1 | Power Play Goals | 2 |
| 7 | Power Play Opportunities | 2 |
| 14.3 | Power Play Percentage | 100.0 |
| 0 | Short Handed Goals | 1 |
| 0 | Shootout Goals | 0 |
| 38 | Faceoffs Won | 35 |
| 52.1 | Faceoff Win Percent | 47.9 |
| 21 | Giveaways | 16 |
| 7 | Total Penalties | 11 |
| 17 | Penalty Minutes | 25 |
 Florida Panthers Injuries
| NAME, POS | STATUS | DATE |
|---|---|---|
| Radko Gudas, D | Out | Jul 1 |
| Jacob Markstrom, G | Out | Jun 30 |
| Carter Verhaeghe, C | Out | Apr 15 |
| Sam Bennett, C | Out | Apr 15 |
| Gustav Forsling, D | Out | Apr 15 |
 Boston Bruins Injuries
| NAME, POS | STATUS | DATE |
|---|---|---|
| Charlie McAvoy, D | Suspension | May 12 |
| Nikita Zadorov, D | Out | May 2 |
| Dans Locmelis, C | Out | Feb 28 |
Game Information
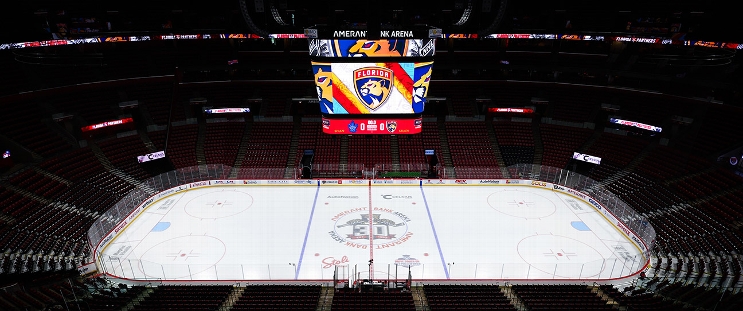 Amerant Bank Arena
Location: Sunrise, FL
Attendance: 18,843 | Capacity:
Location: Sunrise, FL
Attendance: 18,843 | Capacity:
2025-26 Atlantic Division Standings
| TEAM | W | L | PTS | OTL |
|---|---|---|---|---|
| <img src="https://a.espncdn.com/i/teamlogos/nhl/500/buf.png" style="padding: 0 4px; width: 25px; vertical-align: inherit;">Buffalo | 50 | 23 | 109 | 9 |
| <img src="https://a.espncdn.com/i/teamlogos/nhl/500/tb.png" style="padding: 0 4px; width: 25px; vertical-align: inherit;">Tampa Bay | 50 | 26 | 106 | 6 |
| <img src="https://a.espncdn.com/i/teamlogos/nhl/500/mtl.png" style="padding: 0 4px; width: 25px; vertical-align: inherit;">Montreal | 48 | 24 | 106 | 10 |
| <img src="https://a.espncdn.com/i/teamlogos/nhl/500/bos.png" style="padding: 0 4px; width: 25px; vertical-align: inherit;">Boston | 45 | 27 | 100 | 10 |
| <img src="https://a.espncdn.com/i/teamlogos/nhl/500/ott.png" style="padding: 0 4px; width: 25px; vertical-align: inherit;">Ottawa | 44 | 27 | 99 | 11 |
| <img src="https://a.espncdn.com/i/teamlogos/nhl/500/det.png" style="padding: 0 4px; width: 25px; vertical-align: inherit;">Detroit | 41 | 31 | 92 | 10 |
| <img src="https://a.espncdn.com/i/teamlogos/nhl/500/fla.png" style="padding: 0 4px; width: 25px; vertical-align: inherit;">Florida | 40 | 38 | 84 | 4 |
| <img src="https://a.espncdn.com/i/teamlogos/nhl/500/tor.png" style="padding: 0 4px; width: 25px; vertical-align: inherit;">Toronto | 32 | 36 | 78 | 14 |