
Montreal Canadiens at Winnipeg Jets
· National Hockey League
5 - 1

Canadiens beat Jets 5-1 to extend points streak to 5 games

Rookie Oliver Kapanen, Lane Hutson and Phillip Danault, also scored for the Canadiens, who are 4-0-1 during a five-game points streak and 6-2-1 in their last nine.
Montembeault, who made his first start since Jan. 24, had given up three or more goals in five of his six previous starts.
Kyle Connor scored for the Jets and Connor Hellebuyck made 22 saves.
Winnipeg took an early 1-0 lead when Connor scored his 25th goal on a one-timer during a power play at 6:07 of the first period.
Kapanen, who’s heading to the Olympics for Finland, got his 18th goal 10 minutes later when a rebound went off Jet Cole Perfetti’s stick right to him and he then flipped the puck past a sprawled Hellebuyck.
Montreal went ahead 3-1 at 6:44 of the second after goals 76 seconds apart by Anderson and Hutson.
The Jets missed a chance to pull closer then they hit a post and Montembeault later snagged a close-in shot by Dylan DeMelo. They were also stymied on four shots on goal during a power play early in the third.
Gallagher’s goal came with 3 seconds left on a power play at 10:57 of the third. Danault put the puck into an empty net with 14 seconds remaining to cap the scoring.
Jets: At Vancouver on Feb. 25.
—
Regular Season SeriesMTL wins series 2-0
Scoring Summary
 |
Goal | 1st Period 6:07 | Kyle Connor Goal (25) Snap Shot, assists: Gabriel Vilardi (29), Mark Scheifele (41) |
 |
Goal | 1st Period 16:26 | Oliver Kapanen Goal (18) Wrist Shot, assists: Noah Dobson (27), Juraj Slafkovský (24) |
|
Goal | 2nd Period 5:28 | Josh Anderson Goal (12) Tip-In, assists: Jayden Struble (8), Brendan Gallagher (12) |
|
Goal | 2nd Period 6:44 | Lane Hutson Goal (10) Wrist Shot, assists: Josh Anderson (7), Brendan Gallagher (13) |
|
Goal | 3rd Period 10:57 | Brendan Gallagher Goal (6) Snap Shot, assists: Kirby Dach (5), Zachary Bolduc (13) |
|
Goal | 3rd Period 19:46 | Phillip Danault Goal (3) Wrist Shot, assists: Josh Anderson (8), Noah Dobson (28) |
Statistics
 MTL MTL |
 WPG WPG |
|
|---|---|---|
| 11 | Blocked Shots | 16 |
| 21 | Hits | 15 |
| 8 | Takeaways | 1 |
| 27 | Shots | 37 |
| 1 | Power Play Goals | 1 |
| 2 | Power Play Opportunities | 4 |
| 50.0 | Power Play Percentage | 25.0 |
| 1 | Short Handed Goals | 0 |
| 0 | Shootout Goals | 0 |
| 33 | Faceoffs Won | 27 |
| 55.0 | Faceoff Win Percent | 45.0 |
| 11 | Giveaways | 21 |
| 4 | Total Penalties | 2 |
| 8 | Penalty Minutes | 4 |
 Winnipeg Jets Injuries
| NAME, POS | STATUS | DATE |
|---|---|---|
| Elias Salomonsson, D | Out | Apr 30 |
| Neal Pionk, D | Out | Apr 16 |
| Vladislav Namestnikov, C | Out | Apr 16 |
| Gustav Nyquist, RW | Out | Apr 16 |
| Alex Iafallo, LW | Out | Apr 16 |
 Montreal Canadiens Injuries
| NAME, POS | STATUS | DATE |
|---|
Game Information
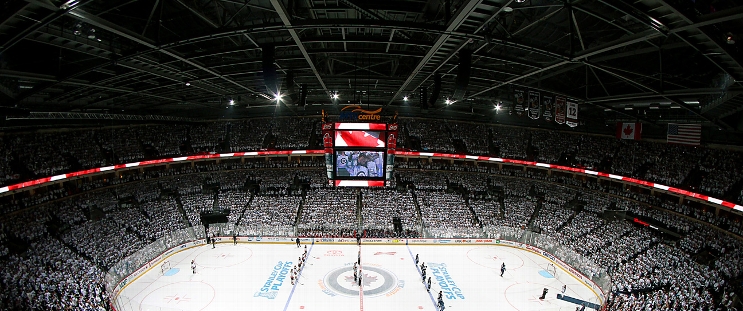 Canada Life Centre
Location: Winnipeg,
Attendance: 15,225 | Capacity:
Location: Winnipeg,
Attendance: 15,225 | Capacity:
2025-26 Atlantic Division Standings
| TEAM | W | L | PTS | OTL |
|---|---|---|---|---|
| <img src="https://a.espncdn.com/i/teamlogos/nhl/500/buf.png" style="padding: 0 4px; width: 25px; vertical-align: inherit;">Buffalo | 50 | 23 | 109 | 9 |
| <img src="https://a.espncdn.com/i/teamlogos/nhl/500/tb.png" style="padding: 0 4px; width: 25px; vertical-align: inherit;">Tampa Bay | 50 | 26 | 106 | 6 |
| <img src="https://a.espncdn.com/i/teamlogos/nhl/500/mtl.png" style="padding: 0 4px; width: 25px; vertical-align: inherit;">Montreal | 48 | 24 | 106 | 10 |
| <img src="https://a.espncdn.com/i/teamlogos/nhl/500/bos.png" style="padding: 0 4px; width: 25px; vertical-align: inherit;">Boston | 45 | 27 | 100 | 10 |
| <img src="https://a.espncdn.com/i/teamlogos/nhl/500/ott.png" style="padding: 0 4px; width: 25px; vertical-align: inherit;">Ottawa | 44 | 27 | 99 | 11 |
| <img src="https://a.espncdn.com/i/teamlogos/nhl/500/det.png" style="padding: 0 4px; width: 25px; vertical-align: inherit;">Detroit | 41 | 31 | 92 | 10 |
| <img src="https://a.espncdn.com/i/teamlogos/nhl/500/fla.png" style="padding: 0 4px; width: 25px; vertical-align: inherit;">Florida | 40 | 38 | 84 | 4 |
| <img src="https://a.espncdn.com/i/teamlogos/nhl/500/tor.png" style="padding: 0 4px; width: 25px; vertical-align: inherit;">Toronto | 32 | 36 | 78 | 14 |
2025-26 Central Division Standings
| TEAM | W | L | PTS | OTL |
|---|---|---|---|---|
| <img src="https://a.espncdn.com/i/teamlogos/nhl/500/col.png" style="padding: 0 4px; width: 25px; vertical-align: inherit;">Colorado | 55 | 16 | 121 | 11 |
| <img src="https://a.espncdn.com/i/teamlogos/nhl/500/dal.png" style="padding: 0 4px; width: 25px; vertical-align: inherit;">Dallas | 50 | 20 | 112 | 12 |
| <img src="https://a.espncdn.com/i/teamlogos/nhl/500/min.png" style="padding: 0 4px; width: 25px; vertical-align: inherit;">Minnesota | 46 | 24 | 104 | 12 |
| <img src="https://a.espncdn.com/i/teamlogos/nhl/500/uta.png" style="padding: 0 4px; width: 25px; vertical-align: inherit;">Utah | 43 | 33 | 92 | 6 |
| <img src="https://a.espncdn.com/i/teamlogos/nhl/500/stl.png" style="padding: 0 4px; width: 25px; vertical-align: inherit;">St. Louis | 37 | 33 | 86 | 12 |
| <img src="https://a.espncdn.com/i/teamlogos/nhl/500/nsh.png" style="padding: 0 4px; width: 25px; vertical-align: inherit;">Nashville | 38 | 34 | 86 | 10 |
| <img src="https://a.espncdn.com/i/teamlogos/nhl/500/wpg.png" style="padding: 0 4px; width: 25px; vertical-align: inherit;">Winnipeg | 35 | 35 | 82 | 12 |
| <img src="https://a.espncdn.com/i/teamlogos/nhl/500/chi.png" style="padding: 0 4px; width: 25px; vertical-align: inherit;">Chicago | 29 | 39 | 72 | 14 |