
Nashville Predators at Columbus Blue Jackets
· National Hockey League
2 - 3

Severson breaks 3rd-period tie in the Blue Jackets' 3-2 win over the Predators

Both teams played Monday night, with Columbus beating the Rangers 5-4 in overtime in New York, and Nashville falling 4-2 at home to Detroit.
Adam Fantilli and Sean Monahan also scored for Columbus, with Monahan tying it at 2 at 1:52 of the third with a short-handed goal. He also had a short-handed goal Monday in New York.
Jet Greaves made 20 saves for Columbus in 51:44, missing an 8:16 stretch of the first period because of concussion protocol after Nick Blankenburg caught him with an elbow on the side of the head on a rush. Elvis Merzlikins stopped both shots on faced before Greaves returned.
Filip Forsberg had a power-play goal for Nashville, and Ryan O’Reilly was credited with a goal in the second that a Columbus player put in. O’Reilly was cut below the eye taking a faceoff midway through the third.
Justus Annunen stopped 24 shots for the Predators.
Before the game, Nashville traded center Michael McCarron to Minnesota for a 2028 second-round pick.
Blue Jackets: Host Florida on Thursday night.
Regular Season SeriesSeries tied 1-1
Scoring Summary
 |
Goal | 1st Period 14:23 | Adam Fantilli Goal (17) Wrist Shot, assists: Kirill Marchenko (29), Mason Marchment (16) |
 |
Goal | 1st Period 19:32 | Filip Forsberg Goal (27) Wrist Shot, assists: Steven Stamkos (17), Luke Evangelista (38) |
|
Goal | 2nd Period 14:39 | Ryan O'Reilly Goal (22) Deflected, assists: none |
|
Goal | 3rd Period 1:52 | Sean Monahan Goal (12) Snap Shot, assists: none |
|
Goal | 3rd Period 6:07 | Charlie Coyle Goal (16) Deflected, assists: Damon Severson (20), Denton Mateychuk (15) |
Statistics
 NSH NSH |
 CBJ CBJ |
|
|---|---|---|
| 16 | Blocked Shots | 16 |
| 12 | Hits | 14 |
| 6 | Takeaways | 4 |
| 25 | Shots | 27 |
| 1 | Power Play Goals | 0 |
| 2 | Power Play Opportunities | 4 |
| 50.0 | Power Play Percentage | 0.0 |
| 0 | Short Handed Goals | 1 |
| 0 | Shootout Goals | 0 |
| 32 | Faceoffs Won | 32 |
| 50.0 | Faceoff Win Percent | 50.0 |
| 15 | Giveaways | 12 |
| 4 | Total Penalties | 2 |
| 8 | Penalty Minutes | 4 |
Game Information
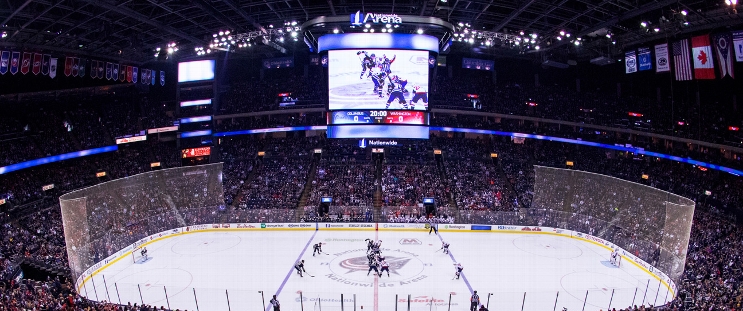 Nationwide Arena
Location: Columbus, OH
Attendance: 16,526 | Capacity:
Location: Columbus, OH
Attendance: 16,526 | Capacity:
2025-26 Central Division Standings
| TEAM | W | L | PTS | OTL |
|---|---|---|---|---|
| <img src="https://a.espncdn.com/i/teamlogos/nhl/500/col.png" style="padding: 0 4px; width: 25px; vertical-align: inherit;">Colorado | 55 | 16 | 121 | 11 |
| <img src="https://a.espncdn.com/i/teamlogos/nhl/500/dal.png" style="padding: 0 4px; width: 25px; vertical-align: inherit;">Dallas | 50 | 20 | 112 | 12 |
| <img src="https://a.espncdn.com/i/teamlogos/nhl/500/min.png" style="padding: 0 4px; width: 25px; vertical-align: inherit;">Minnesota | 46 | 24 | 104 | 12 |
| <img src="https://a.espncdn.com/i/teamlogos/nhl/500/uta.png" style="padding: 0 4px; width: 25px; vertical-align: inherit;">Utah | 43 | 33 | 92 | 6 |
| <img src="https://a.espncdn.com/i/teamlogos/nhl/500/stl.png" style="padding: 0 4px; width: 25px; vertical-align: inherit;">St. Louis | 37 | 33 | 86 | 12 |
| <img src="https://a.espncdn.com/i/teamlogos/nhl/500/nsh.png" style="padding: 0 4px; width: 25px; vertical-align: inherit;">Nashville | 38 | 34 | 86 | 10 |
| <img src="https://a.espncdn.com/i/teamlogos/nhl/500/wpg.png" style="padding: 0 4px; width: 25px; vertical-align: inherit;">Winnipeg | 35 | 35 | 82 | 12 |
| <img src="https://a.espncdn.com/i/teamlogos/nhl/500/chi.png" style="padding: 0 4px; width: 25px; vertical-align: inherit;">Chicago | 29 | 39 | 72 | 14 |
2025-26 Metropolitan Division Standings
| TEAM | W | L | PTS | OTL |
|---|---|---|---|---|
| <img src="https://a.espncdn.com/i/teamlogos/nhl/500/car.png" style="padding: 0 4px; width: 25px; vertical-align: inherit;">Carolina | 53 | 22 | 113 | 7 |
| <img src="https://a.espncdn.com/i/teamlogos/nhl/500/pit.png" style="padding: 0 4px; width: 25px; vertical-align: inherit;">Pittsburgh | 41 | 25 | 98 | 16 |
| <img src="https://a.espncdn.com/i/teamlogos/nhl/500/phi.png" style="padding: 0 4px; width: 25px; vertical-align: inherit;">Philadelphia | 43 | 27 | 98 | 12 |
| <img src="https://a.espncdn.com/i/teamlogos/nhl/500/wsh.png" style="padding: 0 4px; width: 25px; vertical-align: inherit;">Washington | 43 | 30 | 95 | 9 |
| <img src="https://a.espncdn.com/i/teamlogos/nhl/500/cbj.png" style="padding: 0 4px; width: 25px; vertical-align: inherit;">Columbus | 40 | 30 | 92 | 12 |
| <img src="https://a.espncdn.com/i/teamlogos/nhl/500/nyi.png" style="padding: 0 4px; width: 25px; vertical-align: inherit;">NY Islanders | 43 | 34 | 91 | 5 |
| <img src="https://a.espncdn.com/i/teamlogos/nhl/500/nj.png" style="padding: 0 4px; width: 25px; vertical-align: inherit;">New Jersey | 42 | 37 | 87 | 3 |
| <img src="https://a.espncdn.com/i/teamlogos/nhl/500/nyr.png" style="padding: 0 4px; width: 25px; vertical-align: inherit;">NY Rangers | 34 | 39 | 77 | 9 |