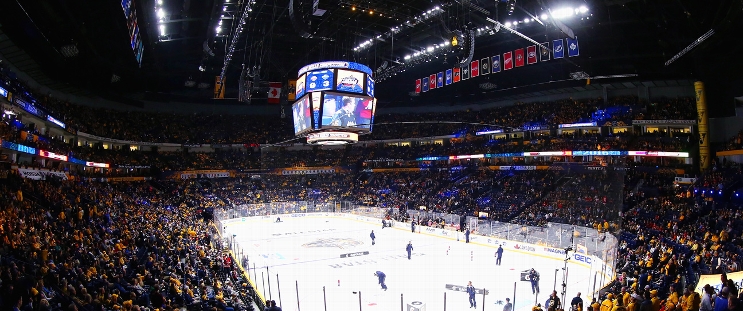
Boston Bruins at Nashville Predators
· National Hockey League
Regular Season Series
BOS leads series 1-0
Statistics
 BOS BOS |
 NSH NSH |
|
|---|---|---|
| 3.13 | Goals Against Average | 3.42 |
| 30.1 | Shots Against per Game | 29.2 |
| 77.0 | Penalty Kill Percentage | 80.9 |
| 48 | Power Play Goals Against | 31 |
| 0 | Short Handed Goals Against | 0 |
| 3.38 | Goals For per Game | 2.89 |
| 27.2 | Shots per Game | 28.5 |
| 43 | Power Play Goals | 35 |
| 26.9 | Power Play Percentage | 21.5 |
| 2 | Short Handed Goals | 4 |
| 752 | Penalty Minutes | 467 |
 Nashville Predators Injuries
| NAME, POS | STATUS | DATE |
|---|
 Boston Bruins Injuries
| NAME, POS | STATUS | DATE |
|---|---|---|
| Elias Lindholm, C | Injured Reserve | Feb 2 |
| Pavel Zacha, C | Out | Jan 30 |
Game Information
 Bridgestone Arena
Location: Nashville, TN
Capacity:

Bridgestone Arena
Location: Nashville, TN
Capacity:
2025-26 Atlantic Division Standings
| TEAM | W | L | PTS | OTL |
|---|---|---|---|---|
 Tampa Bay Tampa Bay |
35 | 14 | 74 | 4 |
 Detroit Detroit |
33 | 18 | 72 | 6 |
 Montreal Montreal |
31 | 17 | 70 | 8 |
 Buffalo Buffalo |
32 | 18 | 69 | 5 |
 Boston Boston |
32 | 20 | 68 | 4 |
 Ottawa Ottawa |
27 | 21 | 61 | 7 |
 Toronto Toronto |
26 | 21 | 61 | 9 |
 Florida Florida |
28 | 24 | 59 | 3 |
2025-26 Central Division Standings
| TEAM | W | L | PTS | OTL |
|---|---|---|---|---|
 Colorado Colorado |
36 | 9 | 81 | 9 |
 Minnesota Minnesota |
33 | 14 | 76 | 10 |
 Dallas Dallas |
33 | 14 | 75 | 9 |
 Utah Utah |
29 | 23 | 62 | 4 |
 Nashville Nashville |
26 | 23 | 58 | 6 |
 Chicago Chicago |
22 | 25 | 53 | 9 |
 Winnipeg Winnipeg |
22 | 25 | 52 | 8 |
 St. Louis St. Louis |
20 | 27 | 49 | 9 |


 NYR
NYR PHI
PHI NJ
NJ NYI
NYI