
Toronto Maple Leafs at Minnesota Wild
· National Hockey League
4 - 2

Groulx scores twice as Maple Leafs hold on and beat the Wild 4-2

Morgan Rielly also scored and Matthew Knies added an empty-net goal for Toronto as Minnesota pushed to rally from a three-goal deficit after two periods.
Anthony Stolarz made 36 saves for the Maple Leafs, who have a win and a shootout loss in two games since Auston Matthews for the season with a knee injury.
Vladimir Tarasenko scored twice for the Wild. Jesper Wallstedt made 22 saves.
In a four-day span, the Wild earned just one point from three home games against non-playoff teams from the East — a shootout loss to the Flyers on Thursday and regulation defeats against the New York Rangers Saturday and Maple Leafs on Sunday.
After a scoreless first period, Toronto scored two quick goals to take charge early in the second. First, Rielly scored on a wrist shot from the left circle that beat Wallstedt over the shoulder at 1:07. Just 68 seconds later, Groulx made it 2-0 when he tipped in a shot from the point by Troy Stecher.
The Maple Leafs extended the lead to 3-0 at 8:18 of the second when Groulx intercepted a clearing attempt at the Wild blue line and fired a shot through traffic that beat a screened Wallstedt.
Early in the third, Tarasenko scored twice in 23 seconds to pull the Wild to within a goal. First, he redirected a cross-ice pass from Mats Zuccarello past Stolarz at the left post at 4:51 of the third. Then, he won a battle along the left boards, skated in and beat Stolarz with a wrist shot. Both goals were assisted by Zuccarello and Ryan Hartman, who Tarasenko joined on the Wild's top line to start the third.
Minnesota pushed hard for the tying goal, putting 17 shots on net in the period, but Stolarz held firm until Knies' empty-netter with 37 seconds left iced the win.
Wild: At Chicago on Tuesday.
Regular Season SeriesSeries tied 1-1
Scoring Summary
 |
Goal | 2nd Period 1:07 | Morgan Rielly Goal (9) Wrist Shot, assists: Matias Maccelli (19), John Tavares (32) |
|
Goal | 2nd Period 2:19 | Benoit-Olivier Groulx Goal (2) Deflected, assists: Troy Stecher (10), Nicholas Robertson (16) |
|
Goal | 2nd Period 8:18 | Benoit-Olivier Groulx Goal (3) Wrist Shot, assists: none |
 |
Goal | 3rd Period 4:51 | Vladimir Tarasenko Goal (17) Snap Shot, assists: Mats Zuccarello (28), Ryan Hartman (14) |
|
Goal | 3rd Period 5:14 | Vladimir Tarasenko Goal (18) Wrist Shot, assists: Ryan Hartman (15), Mats Zuccarello (29) |
|
Goal | 3rd Period 19:23 | Matthew Knies Goal (18) Wrist Shot, assists: none |
Statistics
 TOR TOR |
 MIN MIN |
|
|---|---|---|
| 28 | Blocked Shots | 13 |
| 14 | Hits | 22 |
| 4 | Takeaways | 6 |
| 26 | Shots | 38 |
| 0 | Power Play Goals | 0 |
| 1 | Power Play Opportunities | 2 |
| 0.0 | Power Play Percentage | 0.0 |
| 0 | Short Handed Goals | 0 |
| 0 | Shootout Goals | 0 |
| 29 | Faceoffs Won | 26 |
| 52.7 | Faceoff Win Percent | 47.3 |
| 23 | Giveaways | 16 |
| 4 | Total Penalties | 3 |
| 8 | Penalty Minutes | 6 |
 Minnesota Wild Injuries
| NAME, POS | STATUS | DATE |
|---|---|---|
| Zach Bogosian, D | Out | Jul 1 |
| Filip Gustavsson, G | Out | May 18 |
| Jonas Brodin, D | Out | May 13 |
| Joel Eriksson Ek, C | Out | May 13 |
| Charlie Stramel, C | Out | Apr 6 |
 Toronto Maple Leafs Injuries
| NAME, POS | STATUS | DATE |
|---|---|---|
| Zack MacEwen, C | Injured Reserve | Jul 1 |
| Max Domi, C | Out | May 25 |
| Calle Jarnkrok, C | Out | Apr 15 |
| Dakota Joshua, C | Out | Apr 11 |
| Auston Matthews, C | Out | Mar 19 |
Game Information
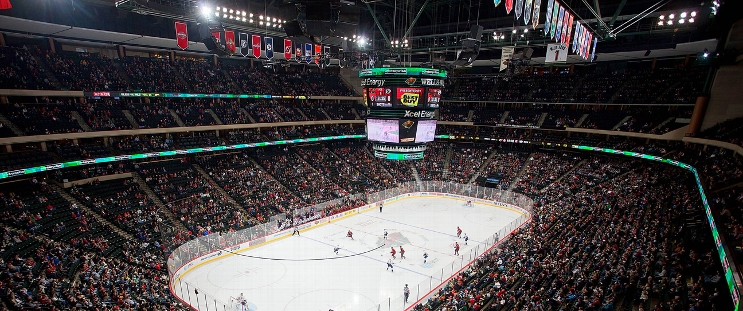 Grand Casino Arena
Location: Saint Paul, MN
Attendance: 17,663 | Capacity:
Location: Saint Paul, MN
Attendance: 17,663 | Capacity:
2025-26 Atlantic Division Standings
| TEAM | W | L | PTS | OTL |
|---|---|---|---|---|
| <img src="https://a.espncdn.com/i/teamlogos/nhl/500/buf.png" style="padding: 0 4px; width: 25px; vertical-align: inherit;">Buffalo | 50 | 23 | 109 | 9 |
| <img src="https://a.espncdn.com/i/teamlogos/nhl/500/tb.png" style="padding: 0 4px; width: 25px; vertical-align: inherit;">Tampa Bay | 50 | 26 | 106 | 6 |
| <img src="https://a.espncdn.com/i/teamlogos/nhl/500/mtl.png" style="padding: 0 4px; width: 25px; vertical-align: inherit;">Montreal | 48 | 24 | 106 | 10 |
| <img src="https://a.espncdn.com/i/teamlogos/nhl/500/bos.png" style="padding: 0 4px; width: 25px; vertical-align: inherit;">Boston | 45 | 27 | 100 | 10 |
| <img src="https://a.espncdn.com/i/teamlogos/nhl/500/ott.png" style="padding: 0 4px; width: 25px; vertical-align: inherit;">Ottawa | 44 | 27 | 99 | 11 |
| <img src="https://a.espncdn.com/i/teamlogos/nhl/500/det.png" style="padding: 0 4px; width: 25px; vertical-align: inherit;">Detroit | 41 | 31 | 92 | 10 |
| <img src="https://a.espncdn.com/i/teamlogos/nhl/500/fla.png" style="padding: 0 4px; width: 25px; vertical-align: inherit;">Florida | 40 | 38 | 84 | 4 |
| <img src="https://a.espncdn.com/i/teamlogos/nhl/500/tor.png" style="padding: 0 4px; width: 25px; vertical-align: inherit;">Toronto | 32 | 36 | 78 | 14 |
2025-26 Central Division Standings
| TEAM | W | L | PTS | OTL |
|---|---|---|---|---|
| <img src="https://a.espncdn.com/i/teamlogos/nhl/500/col.png" style="padding: 0 4px; width: 25px; vertical-align: inherit;">Colorado | 55 | 16 | 121 | 11 |
| <img src="https://a.espncdn.com/i/teamlogos/nhl/500/dal.png" style="padding: 0 4px; width: 25px; vertical-align: inherit;">Dallas | 50 | 20 | 112 | 12 |
| <img src="https://a.espncdn.com/i/teamlogos/nhl/500/min.png" style="padding: 0 4px; width: 25px; vertical-align: inherit;">Minnesota | 46 | 24 | 104 | 12 |
| <img src="https://a.espncdn.com/i/teamlogos/nhl/500/uta.png" style="padding: 0 4px; width: 25px; vertical-align: inherit;">Utah | 43 | 33 | 92 | 6 |
| <img src="https://a.espncdn.com/i/teamlogos/nhl/500/stl.png" style="padding: 0 4px; width: 25px; vertical-align: inherit;">St. Louis | 37 | 33 | 86 | 12 |
| <img src="https://a.espncdn.com/i/teamlogos/nhl/500/nsh.png" style="padding: 0 4px; width: 25px; vertical-align: inherit;">Nashville | 38 | 34 | 86 | 10 |
| <img src="https://a.espncdn.com/i/teamlogos/nhl/500/wpg.png" style="padding: 0 4px; width: 25px; vertical-align: inherit;">Winnipeg | 35 | 35 | 82 | 12 |
| <img src="https://a.espncdn.com/i/teamlogos/nhl/500/chi.png" style="padding: 0 4px; width: 25px; vertical-align: inherit;">Chicago | 29 | 39 | 72 | 14 |