
Nashville Predators at Winnipeg Jets
· National Hockey League
4 - 3

Ryan O’Reilly scores in shootout as Predators edge Jets 4-3

O’Reilly beat Connor Hellebuyck to the glove side in the first round of the shootout. Predators’ netminder Juuse Saros secured the win by stopping Gabriel Vilardi, Mark Scheifele and Kyle Connor.
Matthew Wood, Filip Forsberg and Erik Haula scored in regulation for Nashville. Jonathan Marchessault chipped in with two assists. Saros made 36 saves.
Jonathan Toews forced overtime for Winnipeg, tying the game 3-3 with 1:01 left in the third period.
Josh Morrissey and Vilardi also scored in regulation for the Jets. Connor contributed three assists to extend his point streak to four games, while Scheifele assisted on the game-tying marker. Hellebuyck stopped 20 shots.
The contest was officiated by a single referee, Brandon Schrader, after Chris Lee was unable to attend due to travel issues.
Jets: Visit Boston on Thursday.
Regular Season SeriesWPG wins series 2-1
Scoring Summary
 |
Goal | 1st Period 13:02 | Erik Haula Goal (11) Tip-In, assists: Roman Josi (34), Luke Evangelista (39) |
 |
Goal | 1st Period 19:20 | Josh Morrissey Goal (12) Wrist Shot, assists: Gabriel Vilardi (30), Kyle Connor (45) |
|
Goal | 2nd Period 5:09 | Gabriel Vilardi Goal (26) Wrist Shot, assists: Cole Perfetti (17), Kyle Connor (46) |
|
Goal | 2nd Period 10:48 | Filip Forsberg Goal (29) Slap Shot, assists: Jonathan Marchessault (11), Ryan Ufko (3) |
|
Goal | 3rd Period 14:01 | Matthew Wood Goal (15) Snap Shot, assists: Jonathan Marchessault (12), Filip Forsberg (26) |
|
Goal | 3rd Period 18:59 | Jonathan Toews Goal (8) Snap Shot, assists: Mark Scheifele (52), Kyle Connor (47) |
|
Goal | 5 0:00 | Ryan O'Reilly Goal Snap Shot |
Statistics
 NSH NSH |
 WPG WPG |
|
|---|---|---|
| 17 | Blocked Shots | 13 |
| 21 | Hits | 16 |
| 6 | Takeaways | 3 |
| 23 | Shots | 39 |
| 1 | Power Play Goals | 1 |
| 1 | Power Play Opportunities | 4 |
| 100.0 | Power Play Percentage | 25.0 |
| 0 | Short Handed Goals | 0 |
| 0 | Shootout Goals | 0 |
| 25 | Faceoffs Won | 31 |
| 44.6 | Faceoff Win Percent | 55.4 |
| 8 | Giveaways | 11 |
| 4 | Total Penalties | 1 |
| 8 | Penalty Minutes | 2 |
 Winnipeg Jets Injuries
| NAME, POS | STATUS | DATE |
|---|---|---|
| Elias Salomonsson, D | Out | Apr 30 |
| Neal Pionk, D | Out | Apr 16 |
| Vladislav Namestnikov, C | Out | Apr 16 |
| Gustav Nyquist, RW | Out | Apr 16 |
| Alex Iafallo, LW | Out | Apr 16 |
 Nashville Predators Injuries
| NAME, POS | STATUS | DATE |
|---|
Game Information
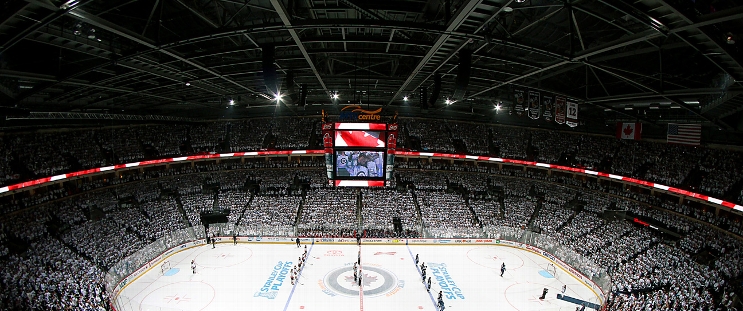 Canada Life Centre
Location: Winnipeg,
Attendance: 13,559 | Capacity:
Location: Winnipeg,
Attendance: 13,559 | Capacity:
2025-26 Central Division Standings
| TEAM | W | L | PTS | OTL |
|---|---|---|---|---|
| <img src="https://a.espncdn.com/i/teamlogos/nhl/500/col.png" style="padding: 0 4px; width: 25px; vertical-align: inherit;">Colorado | 55 | 16 | 121 | 11 |
| <img src="https://a.espncdn.com/i/teamlogos/nhl/500/dal.png" style="padding: 0 4px; width: 25px; vertical-align: inherit;">Dallas | 50 | 20 | 112 | 12 |
| <img src="https://a.espncdn.com/i/teamlogos/nhl/500/min.png" style="padding: 0 4px; width: 25px; vertical-align: inherit;">Minnesota | 46 | 24 | 104 | 12 |
| <img src="https://a.espncdn.com/i/teamlogos/nhl/500/uta.png" style="padding: 0 4px; width: 25px; vertical-align: inherit;">Utah | 43 | 33 | 92 | 6 |
| <img src="https://a.espncdn.com/i/teamlogos/nhl/500/stl.png" style="padding: 0 4px; width: 25px; vertical-align: inherit;">St. Louis | 37 | 33 | 86 | 12 |
| <img src="https://a.espncdn.com/i/teamlogos/nhl/500/nsh.png" style="padding: 0 4px; width: 25px; vertical-align: inherit;">Nashville | 38 | 34 | 86 | 10 |
| <img src="https://a.espncdn.com/i/teamlogos/nhl/500/wpg.png" style="padding: 0 4px; width: 25px; vertical-align: inherit;">Winnipeg | 35 | 35 | 82 | 12 |
| <img src="https://a.espncdn.com/i/teamlogos/nhl/500/chi.png" style="padding: 0 4px; width: 25px; vertical-align: inherit;">Chicago | 29 | 39 | 72 | 14 |