
Ottawa Senators at Detroit Red Wings
· National Hockey League
3 - 2

Carter Yakemchuk scores in NHL debut as streaking Senators top Red Wings, 3-2

Yakemchuk, the No. 7 overall pick of the 2024 draft, had been playing for the American Hockey League’s Belleville Senators. He was called up earlier in the day with defensemen Thomas Chabot, Dennis Gilbert, Nick Jensen, Jake Sanderson and Lassi Thomson sidelined by injuries.
Yakemchuk, a 20-year-old defenseman from Alberta, had 10 goals in 50 games with Belleville.
Brady Tkachuk scored his 20th goal of the season for the Senators, who have won four straight and nine of their last 11 games. Lars Eller scored the other goal for the Senators. Linus Ullmark made 32 saves as the Senators continued their late push for an Eastern Conference playoff berth.
Red Wings captain Dylan Larkin scored on a third-period power play in his first game since missing seven games with a lower-body injury.
Dominik Shine had the other Red Wings goal while John Gibson stopped 18 shots. Detroit had won its three previous meetings with Ottawa this season.
Alex DeBrincat seemingly gave the Red Wings the lead late in the first period. His power-play goal was challenged by Ottawa and the officials ruled that Detroit was offside.
The Senators converted on a power play with 2:45 remaining in the period when Tkachuk tipped in Tim Stutzle's shot.
Yakemchuk scored at 9:28 of the second period. He skated in from the point to the right circle and beat Gibson on the glove side.
Eller made it 3-0 less than two minutes later.
Red Wings: Visit Buffalo on Friday night.
Regular Season SeriesDET wins series 3-1
Scoring Summary
 |
Goal | 1st Period 17:15 | Brady Tkachuk Goal (20) Tip-In, assists: Tim Stützle (41), Carter Yakemchuk (1) |
|
Goal | 2nd Period 9:28 | Carter Yakemchuk Goal (1) Snap Shot, assists: Artem Zub (21) |
|
Goal | 2nd Period 11:05 | Lars Eller Goal (4) Snap Shot, assists: Brady Tkachuk (29) |
 |
Goal | 2nd Period 14:50 | Dominik Shine Goal (3) Tip-In, assists: Simon Edvinsson (13), Moritz Seider (40) |
|
Goal | 3rd Period 4:13 | Dylan Larkin Goal (29) Snap Shot, assists: Alex DeBrincat (39), Lucas Raymond (47) |
Statistics
 OTT OTT |
 DET DET |
|
|---|---|---|
| 9 | Blocked Shots | 14 |
| 26 | Hits | 13 |
| 6 | Takeaways | 4 |
| 21 | Shots | 35 |
| 1 | Power Play Goals | 1 |
| 2 | Power Play Opportunities | 4 |
| 50.0 | Power Play Percentage | 25.0 |
| 0 | Short Handed Goals | 0 |
| 0 | Shootout Goals | 0 |
| 31 | Faceoffs Won | 23 |
| 57.4 | Faceoff Win Percent | 42.6 |
| 19 | Giveaways | 16 |
| 6 | Total Penalties | 4 |
| 15 | Penalty Minutes | 11 |
 Detroit Red Wings Injuries
| NAME, POS | STATUS | DATE |
|---|---|---|
| Viktor Arvidsson, LW | Out | Jul 1 |
| Mason Appleton, C | Out | Apr 15 |
| Michael Rasmussen, C | Out | Apr 7 |
 Ottawa Senators Injuries
| NAME, POS | STATUS | DATE |
|---|---|---|
| Ridly Greig, C | Suspension | May 4 |
| Artem Zub, D | Out | Apr 27 |
| Jake Sanderson, D | Out | Apr 24 |
Game Information
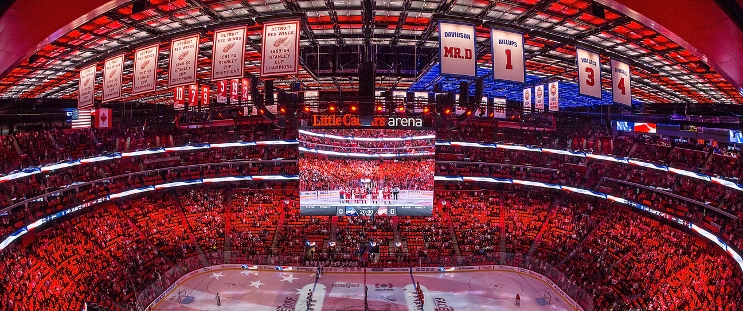 Little Caesars Arena
Location: Detroit, MI
Attendance: 19,515 | Capacity:
Location: Detroit, MI
Attendance: 19,515 | Capacity:
2025-26 Atlantic Division Standings
| TEAM | W | L | PTS | OTL |
|---|---|---|---|---|
| <img src="https://a.espncdn.com/i/teamlogos/nhl/500/buf.png" style="padding: 0 4px; width: 25px; vertical-align: inherit;">Buffalo | 50 | 23 | 109 | 9 |
| <img src="https://a.espncdn.com/i/teamlogos/nhl/500/tb.png" style="padding: 0 4px; width: 25px; vertical-align: inherit;">Tampa Bay | 50 | 26 | 106 | 6 |
| <img src="https://a.espncdn.com/i/teamlogos/nhl/500/mtl.png" style="padding: 0 4px; width: 25px; vertical-align: inherit;">Montreal | 48 | 24 | 106 | 10 |
| <img src="https://a.espncdn.com/i/teamlogos/nhl/500/bos.png" style="padding: 0 4px; width: 25px; vertical-align: inherit;">Boston | 45 | 27 | 100 | 10 |
| <img src="https://a.espncdn.com/i/teamlogos/nhl/500/ott.png" style="padding: 0 4px; width: 25px; vertical-align: inherit;">Ottawa | 44 | 27 | 99 | 11 |
| <img src="https://a.espncdn.com/i/teamlogos/nhl/500/det.png" style="padding: 0 4px; width: 25px; vertical-align: inherit;">Detroit | 41 | 31 | 92 | 10 |
| <img src="https://a.espncdn.com/i/teamlogos/nhl/500/fla.png" style="padding: 0 4px; width: 25px; vertical-align: inherit;">Florida | 40 | 38 | 84 | 4 |
| <img src="https://a.espncdn.com/i/teamlogos/nhl/500/tor.png" style="padding: 0 4px; width: 25px; vertical-align: inherit;">Toronto | 32 | 36 | 78 | 14 |