
Seattle Kraken at Florida Panthers
· National Hockey League
4 - 5

Panthers rally past the Kraken 5-4 in a shootout after blowing a 3-goal lead

The Panthers led 4-1 on Noah Gregor's goal with 7:39 to play, but Seattle's Matty Beniers, Jordan Eberle and Bobby McMann scored in a span of 2:21 to force overtime. Eberle and McMann scored just 14 seconds apart.
Seattle, which has lost eight of 10, has not won since beating the Panthers 6-2 at home on March 15.
Nolan Foote, Eetu Luostarinen and Carter Verhaeghe also scored for the Panthers with Sergei Bobrovsky making 22 saves.
Ryker Evans also scored a third-period goal for Seattle and Joey Daccord had 20 saves.
Beniers cut Seattle’s deficit to 4-2 with 5:43 remaining, beating Bobrovsky off a poke check.
With 3:36 left, Eberle forced a turnover and drove in on Bobrovsky making it 4-3.
McMann tied the score at 4-all 14 seconds later, coming in off the rush and beating Bobrovsky through his skates.
Gregor, called up by the Panthers from the AHL's Charlotte Checkers, got Florida going off the rush in the second period by feeding Foote in front of the net.
In the third, Gregor gave the Panthers a 4-1 lead when he was again trying to feed Foote crashing the net, only his shot from the wall went off Evans and past Daccord.
Florida coach Paul Maurice was honored during a first period break for becoming only the second in NHL history top reach 2,000 games. Scotty Bowman is the other.
Defenseman Aaron Ekblad played in his 800th game — all with the Panthers — which places him four games away from tying injured team captain Aleksander Barkov for the most games in Florida history.
Seattle defenseman Adam Larsson played in his 1,000th NHL game.
Panthers: Host the Minnesota Wild on Thursday night.
Regular Season SeriesSeries tied 1-1
Scoring Summary
 |
Goal | 2nd Period 2:32 | Nolan Foote Goal (1) Snap Shot, assists: Noah Gregor (3), Gustav Forsling (22) |
|
Goal | 3rd Period 5:16 | Eetu Luostarinen Goal (9) Deflected, assists: Vinnie Hinostroza (9), Evan Rodrigues (20) |
|
Goal | 3rd Period 7:37 | Carter Verhaeghe Goal (21) Wrist Shot, assists: none |
 |
Goal | 3rd Period 8:10 | Ryker Evans Goal (8) Slap Shot, assists: Jordan Eberle (28), Berkly Catton (8) |
|
Goal | 3rd Period 12:21 | Noah Gregor Goal (2) , assists: none |
|
Goal | 3rd Period 14:17 | Matty Beniers Goal (19) Wrist Shot, assists: Brandon Montour (21), Adam Larsson (15) |
|
Goal | 3rd Period 16:24 | Jordan Eberle Goal (23) Snap Shot, assists: none |
|
Goal | 3rd Period 16:38 | Bobby McMann Goal (24) Snap Shot, assists: none |
|
Goal | 5 0:00 | Vinnie Hinostroza Goal Backhand |
Statistics
 SEA SEA |
 FLA FLA |
|
|---|---|---|
| 18 | Blocked Shots | 11 |
| 15 | Hits | 34 |
| 5 | Takeaways | 8 |
| 27 | Shots | 24 |
| 0 | Power Play Goals | 0 |
| 1 | Power Play Opportunities | 1 |
| 0.0 | Power Play Percentage | 0.0 |
| 0 | Short Handed Goals | 0 |
| 0 | Shootout Goals | 0 |
| 32 | Faceoffs Won | 23 |
| 58.2 | Faceoff Win Percent | 41.8 |
| 14 | Giveaways | 16 |
| 1 | Total Penalties | 1 |
| 2 | Penalty Minutes | 2 |
 Florida Panthers Injuries
| NAME, POS | STATUS | DATE |
|---|---|---|
| Radko Gudas, D | Out | Jul 1 |
| Jacob Markstrom, G | Out | Jun 30 |
| Carter Verhaeghe, C | Out | Apr 15 |
| Sam Bennett, C | Out | Apr 15 |
| Gustav Forsling, D | Out | Apr 15 |
 Seattle Kraken Injuries
| NAME, POS | STATUS | DATE |
|---|---|---|
| Jared McCann, LW | Out | Apr 17 |
| Joey Daccord, G | Out | Apr 16 |
Game Information
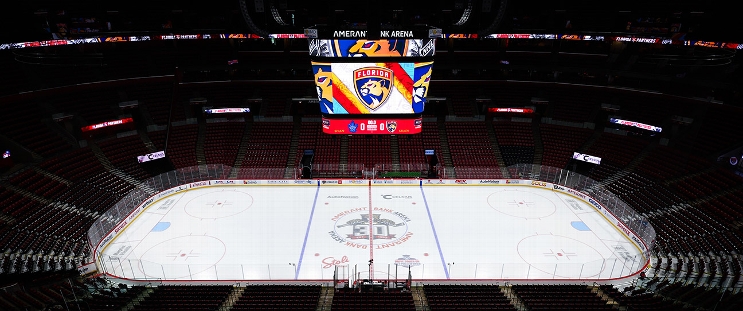 Amerant Bank Arena
Location: Sunrise, FL
Attendance: 19,043 | Capacity:
Location: Sunrise, FL
Attendance: 19,043 | Capacity:
2025-26 Pacific Division Standings
| TEAM | W | L | PTS | OTL |
|---|---|---|---|---|
| <img src="https://a.espncdn.com/i/teamlogos/nhl/500/vgk.png" style="padding: 0 4px; width: 25px; vertical-align: inherit;">Vegas | 39 | 26 | 95 | 17 |
| <img src="https://a.espncdn.com/i/teamlogos/nhl/500/edm.png" style="padding: 0 4px; width: 25px; vertical-align: inherit;">Edmonton | 41 | 30 | 93 | 11 |
| <img src="https://a.espncdn.com/i/teamlogos/nhl/500/ana.png" style="padding: 0 4px; width: 25px; vertical-align: inherit;">Anaheim | 43 | 33 | 92 | 6 |
| <img src="https://a.espncdn.com/i/teamlogos/nhl/500/la.png" style="padding: 0 4px; width: 25px; vertical-align: inherit;">Los Angeles | 35 | 27 | 90 | 20 |
| <img src="https://a.espncdn.com/i/teamlogos/nhl/500/sj.png" style="padding: 0 4px; width: 25px; vertical-align: inherit;">San Jose | 39 | 35 | 86 | 8 |
| <img src="https://a.espncdn.com/i/teamlogos/nhl/500/sea.png" style="padding: 0 4px; width: 25px; vertical-align: inherit;">Seattle | 34 | 37 | 79 | 11 |
| <img src="https://a.espncdn.com/i/teamlogos/nhl/500/cgy.png" style="padding: 0 4px; width: 25px; vertical-align: inherit;">Calgary | 34 | 39 | 77 | 9 |
| <img src="https://a.espncdn.com/i/teamlogos/nhl/500/van.png" style="padding: 0 4px; width: 25px; vertical-align: inherit;">Vancouver | 25 | 49 | 58 | 8 |
2025-26 Atlantic Division Standings
| TEAM | W | L | PTS | OTL |
|---|---|---|---|---|
| <img src="https://a.espncdn.com/i/teamlogos/nhl/500/buf.png" style="padding: 0 4px; width: 25px; vertical-align: inherit;">Buffalo | 50 | 23 | 109 | 9 |
| <img src="https://a.espncdn.com/i/teamlogos/nhl/500/tb.png" style="padding: 0 4px; width: 25px; vertical-align: inherit;">Tampa Bay | 50 | 26 | 106 | 6 |
| <img src="https://a.espncdn.com/i/teamlogos/nhl/500/mtl.png" style="padding: 0 4px; width: 25px; vertical-align: inherit;">Montreal | 48 | 24 | 106 | 10 |
| <img src="https://a.espncdn.com/i/teamlogos/nhl/500/bos.png" style="padding: 0 4px; width: 25px; vertical-align: inherit;">Boston | 45 | 27 | 100 | 10 |
| <img src="https://a.espncdn.com/i/teamlogos/nhl/500/ott.png" style="padding: 0 4px; width: 25px; vertical-align: inherit;">Ottawa | 44 | 27 | 99 | 11 |
| <img src="https://a.espncdn.com/i/teamlogos/nhl/500/det.png" style="padding: 0 4px; width: 25px; vertical-align: inherit;">Detroit | 41 | 31 | 92 | 10 |
| <img src="https://a.espncdn.com/i/teamlogos/nhl/500/fla.png" style="padding: 0 4px; width: 25px; vertical-align: inherit;">Florida | 40 | 38 | 84 | 4 |
| <img src="https://a.espncdn.com/i/teamlogos/nhl/500/tor.png" style="padding: 0 4px; width: 25px; vertical-align: inherit;">Toronto | 32 | 36 | 78 | 14 |