
New Jersey Devils at Dallas Stars
· National Hockey League
6 - 4

Jack Hughes scores twice in a 4-goal 1st for Devils as Stars lose 2nd straight in regulation

Jesper Bratt and Connor Brown also had goals as the Devils put four of their first five shots past Jake Oettinger to end the Dallas goalie's career-best point streak at 14 games. Oettinger was pulled after the first period.
Wyatt Johnston had two goals to reach 40 for the first time in his career, and Jason Robertson scored his 39th for Dallas, which hadn't lost two in a row in regulation since dropping three straight from Jan. 13-18.
Johnston's second goal was his NHL-leading 24th on the power play, extending his franchise record set two nights earlier in a 3-2 loss to Vegas.
Playing for the first time since clinching a Western Conference playoff spot, the Stars lost to an East also-ran and fell seven points behind NHL-leading Colorado, their Central Division rival.
Hughes beat Oettinger one-on-one for both his goals, the latter when Luke Hughes connected with him on a two-line pass for a breakaway and a 4-1 lead 17:19 into the first.
Hughes has eight goals in eight games after going without one in his first five games following the gold medal-winning goal for Team USA against Canada in the Milan Cortina Olympics.
Johnston tied his career high with his 38th assist when Robertson got Dallas within a goal midway through the second period.
New Jersey's Timo Meier and Mavrik Bourque of Dallas traded third-period goals before an empty-netter from Dougie Hamilton.
Casey DeSmith replaced Oettinger and gave the Stars a chance late by stopping the first 12 shots he faced. Jake Allen had 23 saves for the Devils.
Stars: At the Islanders on Thursday to start a four-game trip.
Regular Season SeriesSeries tied 1-1
Scoring Summary
 |
Goal | 1st Period 4:12 | Jack Hughes Goal (19) Snap Shot, assists: Simon Nemec (14) |
 |
Goal | 1st Period 8:16 | Wyatt Johnston Goal (39) Snap Shot, assists: Thomas Harley (25), Jason Robertson (45) |
|
Goal | 1st Period 9:11 | Jesper Bratt Goal (18) Wrist Shot, assists: Jonas Siegenthaler (8), Dougie Hamilton (22) |
|
Goal | 1st Period 12:52 | Connor Brown Goal (14) Snap Shot, assists: Arseny Gritsyuk (18), Jonas Siegenthaler (9) |
|
Goal | 1st Period 17:19 | Jack Hughes Goal (20) Snap Shot, assists: Luke Hughes (27), Jesper Bratt (39) |
|
Goal | 2nd Period 1:11 | Wyatt Johnston Goal (40) Snap Shot, assists: Matt Duchene (22), Jason Robertson (46) |
|
Goal | 2nd Period 12:31 | Jason Robertson Goal (39) Snap Shot, assists: Nils Lundkvist (7), Wyatt Johnston (38) |
|
Goal | 3rd Period 6:46 | Timo Meier Goal (20) Snap Shot, assists: Nico Hischier (29), Dawson Mercer (19) |
|
Goal | 3rd Period 13:08 | Mavrik Bourque Goal (14) Tip-In, assists: Justin Hryckowian (14), Thomas Harley (26) |
|
Goal | 3rd Period 19:00 | Dougie Hamilton Goal (10) Snap Shot, assists: none |
Statistics
 NJ NJ |
 DAL DAL |
|
|---|---|---|
| 22 | Blocked Shots | 13 |
| 15 | Hits | 21 |
| 4 | Takeaways | 9 |
| 25 | Shots | 27 |
| 0 | Power Play Goals | 1 |
| 3 | Power Play Opportunities | 4 |
| 0.0 | Power Play Percentage | 25.0 |
| 0 | Short Handed Goals | 0 |
| 0 | Shootout Goals | 0 |
| 30 | Faceoffs Won | 30 |
| 50.0 | Faceoff Win Percent | 50.0 |
| 12 | Giveaways | 15 |
| 4 | Total Penalties | 3 |
| 8 | Penalty Minutes | 6 |
 Dallas Stars Injuries
| NAME, POS | STATUS | DATE |
|---|---|---|
| Arttu Hyry, RW | Out | Jul 1 |
| Roope Hintz, C | Out | May 4 |
| Tyler Seguin, C | Injured Reserve | May 4 |
| Nils Lundkvist, D | Out | Apr 29 |
 New Jersey Devils Injuries
| NAME, POS | STATUS | DATE |
|---|---|---|
| Arseny Gritsyuk, RW | Out | Jun 30 |
| Evan Rodrigues, C | Injured Reserve | Jun 30 |
| Jonas Siegenthaler, D | Out | May 4 |
| Brett Pesce, D | Injured Reserve | Apr 13 |
| Luke Hughes, D | Out | Apr 9 |
Game Information
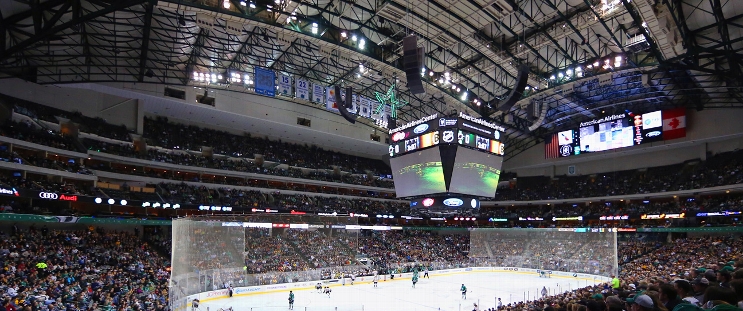 American Airlines Center
Location: Dallas, TX
Attendance: 18,532 | Capacity:
Location: Dallas, TX
Attendance: 18,532 | Capacity:
2025-26 Metropolitan Division Standings
| TEAM | W | L | PTS | OTL |
|---|---|---|---|---|
| <img src="https://a.espncdn.com/i/teamlogos/nhl/500/car.png" style="padding: 0 4px; width: 25px; vertical-align: inherit;">Carolina | 53 | 22 | 113 | 7 |
| <img src="https://a.espncdn.com/i/teamlogos/nhl/500/pit.png" style="padding: 0 4px; width: 25px; vertical-align: inherit;">Pittsburgh | 41 | 25 | 98 | 16 |
| <img src="https://a.espncdn.com/i/teamlogos/nhl/500/phi.png" style="padding: 0 4px; width: 25px; vertical-align: inherit;">Philadelphia | 43 | 27 | 98 | 12 |
| <img src="https://a.espncdn.com/i/teamlogos/nhl/500/wsh.png" style="padding: 0 4px; width: 25px; vertical-align: inherit;">Washington | 43 | 30 | 95 | 9 |
| <img src="https://a.espncdn.com/i/teamlogos/nhl/500/cbj.png" style="padding: 0 4px; width: 25px; vertical-align: inherit;">Columbus | 40 | 30 | 92 | 12 |
| <img src="https://a.espncdn.com/i/teamlogos/nhl/500/nyi.png" style="padding: 0 4px; width: 25px; vertical-align: inherit;">NY Islanders | 43 | 34 | 91 | 5 |
| <img src="https://a.espncdn.com/i/teamlogos/nhl/500/nj.png" style="padding: 0 4px; width: 25px; vertical-align: inherit;">New Jersey | 42 | 37 | 87 | 3 |
| <img src="https://a.espncdn.com/i/teamlogos/nhl/500/nyr.png" style="padding: 0 4px; width: 25px; vertical-align: inherit;">NY Rangers | 34 | 39 | 77 | 9 |
2025-26 Central Division Standings
| TEAM | W | L | PTS | OTL |
|---|---|---|---|---|
| <img src="https://a.espncdn.com/i/teamlogos/nhl/500/col.png" style="padding: 0 4px; width: 25px; vertical-align: inherit;">Colorado | 55 | 16 | 121 | 11 |
| <img src="https://a.espncdn.com/i/teamlogos/nhl/500/dal.png" style="padding: 0 4px; width: 25px; vertical-align: inherit;">Dallas | 50 | 20 | 112 | 12 |
| <img src="https://a.espncdn.com/i/teamlogos/nhl/500/min.png" style="padding: 0 4px; width: 25px; vertical-align: inherit;">Minnesota | 46 | 24 | 104 | 12 |
| <img src="https://a.espncdn.com/i/teamlogos/nhl/500/uta.png" style="padding: 0 4px; width: 25px; vertical-align: inherit;">Utah | 43 | 33 | 92 | 6 |
| <img src="https://a.espncdn.com/i/teamlogos/nhl/500/stl.png" style="padding: 0 4px; width: 25px; vertical-align: inherit;">St. Louis | 37 | 33 | 86 | 12 |
| <img src="https://a.espncdn.com/i/teamlogos/nhl/500/nsh.png" style="padding: 0 4px; width: 25px; vertical-align: inherit;">Nashville | 38 | 34 | 86 | 10 |
| <img src="https://a.espncdn.com/i/teamlogos/nhl/500/wpg.png" style="padding: 0 4px; width: 25px; vertical-align: inherit;">Winnipeg | 35 | 35 | 82 | 12 |
| <img src="https://a.espncdn.com/i/teamlogos/nhl/500/chi.png" style="padding: 0 4px; width: 25px; vertical-align: inherit;">Chicago | 29 | 39 | 72 | 14 |