
Philadelphia Flyers at Detroit Red Wings
· National Hockey League
5 - 3

Owen Tippett’s hat trick powers the Flyers to a 5-3 win over the Red Wings

Tippett's third career hat trick gives him seven goals in his last nine games. The Flyers have won seven of those nine and are now three points behind the Columbus Blue Jackets for the second Eastern Conference wild-card spot.
Detroit has lost three of four and is now tied with Ottawa, two points ahead of the Flyers and one point behind the Blue Jackets.
Detroit trailed 4-0 with seven minutes to play, but Mason Appleton, Alex DeBrincat and Lucas Raymond scored in a span of 2:31 to make it a one-goal game. Philadelphia's Sean Couturier ended the comeback by scoring an empty-net goal at 17:56. Dan Vladar finished with 29 saves for the win.
Philadelphia only needed 4:07 to take the lead. Moritz Seider turned the puck over at center ice and Trevor Zegras fed Tippett for a breakaway. Tippett went five-hole on John Gibson (18 saves).
Tippett made it 2-0 at 12:22 of the second period when his wrist shot from the high slot trickled through Gibson's pads and slid across the line.
With Dylan Larkin in the box, Noah Cates put the Flyers ahead by three goals by shoving a loose puck over the goal line on the power play with less than four minutes to play in the second.
Seider appeared to score for Detroit, but the Flyers successfully challenged that DeBrincat had been offside.
The Flyers had a goal called back for offside in the first minute of the third period. Tippett finished off his hat trick with a power-play goal at 7:19.
Red Wings: Visit the Pittsburgh Penguins on Tuesday night.
Regular Season SeriesPHI leads series 1-0
Scoring Summary
 |
Goal | 1st Period 4:07 | Owen Tippett Goal (25) Wrist Shot, assists: Trevor Zegras (36) |
|
Goal | 2nd Period 12:22 | Owen Tippett Goal (26) Wrist Shot, assists: Denver Barkey (9), Jamie Drysdale (21) |
|
Goal | 2nd Period 16:08 | Noah Cates Goal (17) Wrist Shot, assists: Matvei Michkov (23), Travis Konecny (36) |
|
Goal | 3rd Period 7:19 | Owen Tippett Goal (27) Snap Shot, assists: Jamie Drysdale (22), Travis Konecny (37) |
 |
Goal | 3rd Period 13:43 | Mason Appleton Goal (6) Snap Shot, assists: Justin Faulk (23) |
|
Goal | 3rd Period 15:10 | Alex DeBrincat Goal (37) Wrist Shot, assists: Patrick Kane (32), Moritz Seider (43) |
|
Goal | 3rd Period 16:14 | Lucas Raymond Goal (24) Snap Shot, assists: Moritz Seider (44), Patrick Kane (33) |
|
Goal | 3rd Period 17:56 | Sean Couturier Goal (10) Wrist Shot, assists: Owen Tippett (21) |
Statistics
 PHI PHI |
 DET DET |
|
|---|---|---|
| 14 | Blocked Shots | 9 |
| 25 | Hits | 22 |
| 4 | Takeaways | 6 |
| 26 | Shots | 35 |
| 2 | Power Play Goals | 0 |
| 2 | Power Play Opportunities | 2 |
| 100.0 | Power Play Percentage | 0.0 |
| 0 | Short Handed Goals | 0 |
| 0 | Shootout Goals | 0 |
| 34 | Faceoffs Won | 28 |
| 54.8 | Faceoff Win Percent | 45.2 |
| 14 | Giveaways | 13 |
| 3 | Total Penalties | 4 |
| 6 | Penalty Minutes | 16 |
 Detroit Red Wings Injuries
| NAME, POS | STATUS | DATE |
|---|---|---|
| Viktor Arvidsson, LW | Out | Jul 1 |
| Mason Appleton, C | Out | Apr 15 |
| Michael Rasmussen, C | Out | Apr 7 |
 Philadelphia Flyers Injuries
| NAME, POS | STATUS | DATE |
|---|---|---|
| Nikita Grebenkin, RW | Out | May 14 |
| Noah Cates, LW | Out | May 12 |
| Owen Tippett, RW | Out | May 11 |
| Ty Murchison, D | Out | Feb 3 |
Game Information
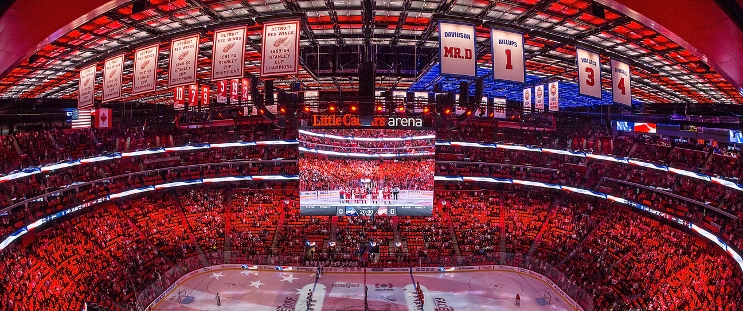 Little Caesars Arena
Location: Detroit, MI
Attendance: 19,515 | Capacity:
Location: Detroit, MI
Attendance: 19,515 | Capacity:
2025-26 Metropolitan Division Standings
| TEAM | W | L | PTS | OTL |
|---|---|---|---|---|
| <img src="https://a.espncdn.com/i/teamlogos/nhl/500/car.png" style="padding: 0 4px; width: 25px; vertical-align: inherit;">Carolina | 53 | 22 | 113 | 7 |
| <img src="https://a.espncdn.com/i/teamlogos/nhl/500/pit.png" style="padding: 0 4px; width: 25px; vertical-align: inherit;">Pittsburgh | 41 | 25 | 98 | 16 |
| <img src="https://a.espncdn.com/i/teamlogos/nhl/500/phi.png" style="padding: 0 4px; width: 25px; vertical-align: inherit;">Philadelphia | 43 | 27 | 98 | 12 |
| <img src="https://a.espncdn.com/i/teamlogos/nhl/500/wsh.png" style="padding: 0 4px; width: 25px; vertical-align: inherit;">Washington | 43 | 30 | 95 | 9 |
| <img src="https://a.espncdn.com/i/teamlogos/nhl/500/cbj.png" style="padding: 0 4px; width: 25px; vertical-align: inherit;">Columbus | 40 | 30 | 92 | 12 |
| <img src="https://a.espncdn.com/i/teamlogos/nhl/500/nyi.png" style="padding: 0 4px; width: 25px; vertical-align: inherit;">NY Islanders | 43 | 34 | 91 | 5 |
| <img src="https://a.espncdn.com/i/teamlogos/nhl/500/nj.png" style="padding: 0 4px; width: 25px; vertical-align: inherit;">New Jersey | 42 | 37 | 87 | 3 |
| <img src="https://a.espncdn.com/i/teamlogos/nhl/500/nyr.png" style="padding: 0 4px; width: 25px; vertical-align: inherit;">NY Rangers | 34 | 39 | 77 | 9 |
2025-26 Atlantic Division Standings
| TEAM | W | L | PTS | OTL |
|---|---|---|---|---|
| <img src="https://a.espncdn.com/i/teamlogos/nhl/500/buf.png" style="padding: 0 4px; width: 25px; vertical-align: inherit;">Buffalo | 50 | 23 | 109 | 9 |
| <img src="https://a.espncdn.com/i/teamlogos/nhl/500/tb.png" style="padding: 0 4px; width: 25px; vertical-align: inherit;">Tampa Bay | 50 | 26 | 106 | 6 |
| <img src="https://a.espncdn.com/i/teamlogos/nhl/500/mtl.png" style="padding: 0 4px; width: 25px; vertical-align: inherit;">Montreal | 48 | 24 | 106 | 10 |
| <img src="https://a.espncdn.com/i/teamlogos/nhl/500/bos.png" style="padding: 0 4px; width: 25px; vertical-align: inherit;">Boston | 45 | 27 | 100 | 10 |
| <img src="https://a.espncdn.com/i/teamlogos/nhl/500/ott.png" style="padding: 0 4px; width: 25px; vertical-align: inherit;">Ottawa | 44 | 27 | 99 | 11 |
| <img src="https://a.espncdn.com/i/teamlogos/nhl/500/det.png" style="padding: 0 4px; width: 25px; vertical-align: inherit;">Detroit | 41 | 31 | 92 | 10 |
| <img src="https://a.espncdn.com/i/teamlogos/nhl/500/fla.png" style="padding: 0 4px; width: 25px; vertical-align: inherit;">Florida | 40 | 38 | 84 | 4 |
| <img src="https://a.espncdn.com/i/teamlogos/nhl/500/tor.png" style="padding: 0 4px; width: 25px; vertical-align: inherit;">Toronto | 32 | 36 | 78 | 14 |