
Vancouver Canucks at Colorado Avalanche
· National Hockey League
8 - 6

Boeser has hat trick, last-place Canucks overcome blowing 4-goal lead to beat NHL-leading Avs 8-6

The Canucks, who entered the game 58 points behind the Avalanche, scored in all sorts of ways, including 29 seconds into the game, short-handed, on the power play and into an empty net to snap a six-game slide.
They led 6-2 in the second only to see Colorado tie it up with 6:02 left. Just 23 seconds later, Pettersson knocked in his first goal since November. Boeser sealed it by lining the puck down the ice and into an empty net.
Teddy Blueger scored twice, while Max Sasson and Jake DeBrusk also added goals to spoil a night in which Nathan MacKinnon became the first player this season to reach 50 goals. Vancouver took advantage of the Avalanche juggling their defensive pairings with Cale Makar sidelined by an upper-body injury.
Kevin Lankinen made 24 saves.
Sam Malinski scored twice, while Gabriel Landeskog, Parker Kelly and Brent Burns also scored. MacKinnon notched his second 50-goal campaign of his career with his score early in the first.
Colorado goaltender Mackenzie Blackwood was pulled with 4:39 left in the second after allowing six goals on 19 shots. Scott Wedgewood stopped five shots in relief.
The Avalanche were rolling after a 9-2 win over Calgary on Monday.
Before fans had a chance to settle into their seats, the Canucks were up 1-0. Sasson's goal 29 seconds into the game was the fastest by the Canucks since Oct. 22, 2024 (21 seconds).
Burns had a goal and an assist as he played in his 999th straight game. The all-time Ironman streak belongs to Phil Kessel, who skated in 1,064 consecutive games.
Avalanche: At Dallas on Saturday.
Regular Season SeriesCOL wins series 2-1
Scoring Summary
 |
Goal | 1st Period 0:29 | Max Sasson Goal (12) Snap Shot, assists: Filip Hronek (35), Zeev Buium (19) |
 |
Goal | 1st Period 1:22 | Nathan MacKinnon Goal (50) Wrist Shot, assists: Devon Toews (18), Sam Malinski (30) |
|
Goal | 1st Period 5:21 | Teddy Blueger Goal (7) Wrist Shot, assists: Liam Ohgren (8) |
|
Goal | 1st Period 11:38 | Jake DeBrusk Goal (17) Tip-In, assists: Elias Pettersson (32), Marco Rossi (20) |
|
Goal | 1st Period 16:05 | Gabriel Landeskog Goal (12) Tip-In, assists: Brent Burns (20), Valeri Nichushkin (29) |
|
Goal | 2nd Period 5:02 | Teddy Blueger Goal (8) Wrist Shot, assists: Max Sasson (5), Marcus Pettersson (14) |
|
Goal | 2nd Period 9:42 | Brock Boeser Goal (19) Snap Shot, assists: Tom Willander (15), Marco Rossi (21) |
|
Goal | 2nd Period 15:21 | Brock Boeser Goal (20) Wrist Shot, assists: Drew O'Connor (11) |
|
Goal | 2nd Period 15:43 | Sam Malinski Goal (6) Wrist Shot, assists: Devon Toews (19) |
|
Goal | 3rd Period 0:14 | Parker Kelly Goal (19) Wrist Shot, assists: Jack Drury (17), Josh Manson (25) |
|
Goal | 3rd Period 13:21 | Brent Burns Goal (11) Snap Shot, assists: Brock Nelson (29), Valeri Nichushkin (30) |
|
Goal | 3rd Period 13:58 | Sam Malinski Goal (7) Wrist Shot, assists: none |
|
Goal | 3rd Period 14:21 | Marcus Pettersson Goal (2) Slap Shot, assists: Brock Boeser (22), Drew O'Connor (12) |
|
Goal | 3rd Period 18:31 | Brock Boeser Goal (21) Wrist Shot, assists: Marcus Pettersson (15) |
Statistics
 VAN VAN |
 COL COL |
|
|---|---|---|
| 14 | Blocked Shots | 8 |
| 21 | Hits | 11 |
| 5 | Takeaways | 2 |
| 26 | Shots | 30 |
| 1 | Power Play Goals | 0 |
| 3 | Power Play Opportunities | 3 |
| 33.3 | Power Play Percentage | 0.0 |
| 1 | Short Handed Goals | 0 |
| 0 | Shootout Goals | 0 |
| 34 | Faceoffs Won | 27 |
| 55.7 | Faceoff Win Percent | 44.3 |
| 8 | Giveaways | 24 |
| 3 | Total Penalties | 3 |
| 6 | Penalty Minutes | 6 |
 Colorado Avalanche Injuries
| NAME, POS | STATUS | DATE |
|---|---|---|
| Jaden Schwartz, C | Out | Jul 1 |
 Vancouver Canucks Injuries
| NAME, POS | STATUS | DATE |
|---|---|---|
| Evander Kane, LW | Out | Apr 14 |
| Thatcher Demko, G | Injured Reserve | Mar 3 |
| Jonathan Lekkerimaki, RW | Out | Feb 27 |
| Filip Chytil, C | Injured Reserve | Feb 25 |
| Derek Forbort, D | Injured Reserve | Oct 28 |
Game Information
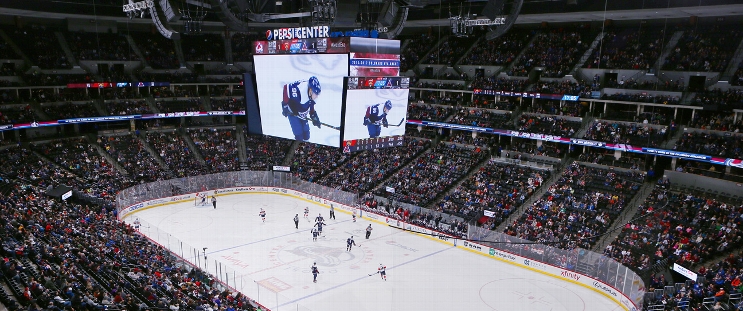 Ball Arena
Location: Denver, CO
Attendance: 18,103 | Capacity:
Location: Denver, CO
Attendance: 18,103 | Capacity:
2025-26 Pacific Division Standings
| TEAM | W | L | PTS | OTL |
|---|---|---|---|---|
| <img src="https://a.espncdn.com/i/teamlogos/nhl/500/vgk.png" style="padding: 0 4px; width: 25px; vertical-align: inherit;">Vegas | 39 | 26 | 95 | 17 |
| <img src="https://a.espncdn.com/i/teamlogos/nhl/500/edm.png" style="padding: 0 4px; width: 25px; vertical-align: inherit;">Edmonton | 41 | 30 | 93 | 11 |
| <img src="https://a.espncdn.com/i/teamlogos/nhl/500/ana.png" style="padding: 0 4px; width: 25px; vertical-align: inherit;">Anaheim | 43 | 33 | 92 | 6 |
| <img src="https://a.espncdn.com/i/teamlogos/nhl/500/la.png" style="padding: 0 4px; width: 25px; vertical-align: inherit;">Los Angeles | 35 | 27 | 90 | 20 |
| <img src="https://a.espncdn.com/i/teamlogos/nhl/500/sj.png" style="padding: 0 4px; width: 25px; vertical-align: inherit;">San Jose | 39 | 35 | 86 | 8 |
| <img src="https://a.espncdn.com/i/teamlogos/nhl/500/sea.png" style="padding: 0 4px; width: 25px; vertical-align: inherit;">Seattle | 34 | 37 | 79 | 11 |
| <img src="https://a.espncdn.com/i/teamlogos/nhl/500/cgy.png" style="padding: 0 4px; width: 25px; vertical-align: inherit;">Calgary | 34 | 39 | 77 | 9 |
| <img src="https://a.espncdn.com/i/teamlogos/nhl/500/van.png" style="padding: 0 4px; width: 25px; vertical-align: inherit;">Vancouver | 25 | 49 | 58 | 8 |
2025-26 Central Division Standings
| TEAM | W | L | PTS | OTL |
|---|---|---|---|---|
| <img src="https://a.espncdn.com/i/teamlogos/nhl/500/col.png" style="padding: 0 4px; width: 25px; vertical-align: inherit;">Colorado | 55 | 16 | 121 | 11 |
| <img src="https://a.espncdn.com/i/teamlogos/nhl/500/dal.png" style="padding: 0 4px; width: 25px; vertical-align: inherit;">Dallas | 50 | 20 | 112 | 12 |
| <img src="https://a.espncdn.com/i/teamlogos/nhl/500/min.png" style="padding: 0 4px; width: 25px; vertical-align: inherit;">Minnesota | 46 | 24 | 104 | 12 |
| <img src="https://a.espncdn.com/i/teamlogos/nhl/500/uta.png" style="padding: 0 4px; width: 25px; vertical-align: inherit;">Utah | 43 | 33 | 92 | 6 |
| <img src="https://a.espncdn.com/i/teamlogos/nhl/500/stl.png" style="padding: 0 4px; width: 25px; vertical-align: inherit;">St. Louis | 37 | 33 | 86 | 12 |
| <img src="https://a.espncdn.com/i/teamlogos/nhl/500/nsh.png" style="padding: 0 4px; width: 25px; vertical-align: inherit;">Nashville | 38 | 34 | 86 | 10 |
| <img src="https://a.espncdn.com/i/teamlogos/nhl/500/wpg.png" style="padding: 0 4px; width: 25px; vertical-align: inherit;">Winnipeg | 35 | 35 | 82 | 12 |
| <img src="https://a.espncdn.com/i/teamlogos/nhl/500/chi.png" style="padding: 0 4px; width: 25px; vertical-align: inherit;">Chicago | 29 | 39 | 72 | 14 |