
Boston Bruins at Florida Panthers
· National Hockey League
1 - 2

Two-time Stanley Cup champion Panthers avoid playoff elimination with 2-1 win over Bruins

The two-time defending Stanley Cup champion Panthers avoided elimination from the playoffs with the win.
Florida got first-period goals from Mackie Samoskevich and Sam Bennett in their second straight win.
Boston, which had won four straight, got a goal from Fraser Minten. Jeremy Swayman made 22 saves in the loss.
The Panthers also used a fast start in a 6-3 win over the Ottawa Senators on Tuesday night, scoring five goals in the opening period.
Samoskevich opened the scoring with his third goal in as many games when he intercepted a pass deep in the offensive zone and sent a wrist shot past Swayman.
Bennett made it 2-0 at 7:39 of the first, scoring from the slot.
Boston pulled to within a goal in the closing minute of the first period.
The Bruins put two shots on Bobrovsky near the front of the net, and the puck squirted out along the goal line right to where Minten was all alone.
Minten had plenty of time to grab the puck, put it on his backhand, and beat a sprawled out Bobrovsky to make it 2-1 with 27 seconds left in the period.
Bobrovsky, who has won five of his past seven starts, had a big challenge in the third, but held strong.
The two-time defending Stanley Cup champion Panthers avoided elimination from the playoffs with Thursday's win.
Panthers: At Pittsburgh on Saturday.
Regular Season SeriesFLA wins series 3-0
Scoring Summary
 |
Goal | 1st Period 4:20 | Mackie Samoskevich Goal (9) Snap Shot, assists: none |
|
Goal | 1st Period 7:39 | Sam Bennett Goal (26) Snap Shot, assists: A.J. Greer (12) |
 |
Goal | 1st Period 19:33 | Fraser Minten Goal (17) Snap Shot, assists: Marat Khusnutdinov (18), David Pastrnak (67) |
Statistics
 BOS BOS |
 FLA FLA |
|
|---|---|---|
| 18 | Blocked Shots | 18 |
| 22 | Hits | 22 |
| 4 | Takeaways | 6 |
| 29 | Shots | 24 |
| 0 | Power Play Goals | 0 |
| 2 | Power Play Opportunities | 1 |
| 0.0 | Power Play Percentage | 0.0 |
| 0 | Short Handed Goals | 0 |
| 0 | Shootout Goals | 0 |
| 38 | Faceoffs Won | 22 |
| 63.3 | Faceoff Win Percent | 36.7 |
| 21 | Giveaways | 11 |
| 1 | Total Penalties | 2 |
| 2 | Penalty Minutes | 4 |
 Florida Panthers Injuries
| NAME, POS | STATUS | DATE |
|---|---|---|
| Radko Gudas, D | Out | Jul 1 |
| Jacob Markstrom, G | Out | Jun 30 |
| Carter Verhaeghe, C | Out | Apr 15 |
| Sam Bennett, C | Out | Apr 15 |
| Gustav Forsling, D | Out | Apr 15 |
 Boston Bruins Injuries
| NAME, POS | STATUS | DATE |
|---|---|---|
| Charlie McAvoy, D | Suspension | May 12 |
| Nikita Zadorov, D | Out | May 2 |
| Dans Locmelis, C | Out | Feb 28 |
Game Information
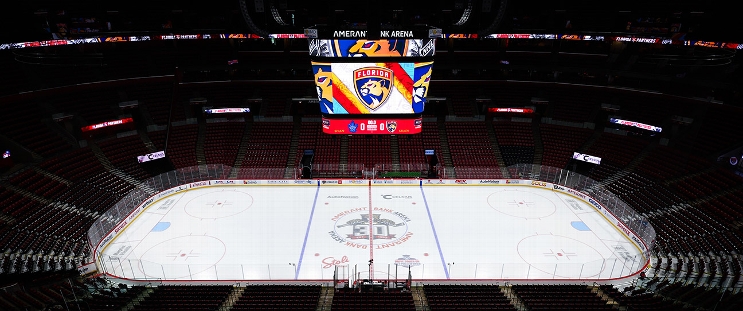 Amerant Bank Arena
Location: Sunrise, FL
Attendance: 19,823 | Capacity:
Location: Sunrise, FL
Attendance: 19,823 | Capacity:
2025-26 Atlantic Division Standings
| TEAM | W | L | PTS | OTL |
|---|---|---|---|---|
| <img src="https://a.espncdn.com/i/teamlogos/nhl/500/buf.png" style="padding: 0 4px; width: 25px; vertical-align: inherit;">Buffalo | 50 | 23 | 109 | 9 |
| <img src="https://a.espncdn.com/i/teamlogos/nhl/500/tb.png" style="padding: 0 4px; width: 25px; vertical-align: inherit;">Tampa Bay | 50 | 26 | 106 | 6 |
| <img src="https://a.espncdn.com/i/teamlogos/nhl/500/mtl.png" style="padding: 0 4px; width: 25px; vertical-align: inherit;">Montreal | 48 | 24 | 106 | 10 |
| <img src="https://a.espncdn.com/i/teamlogos/nhl/500/bos.png" style="padding: 0 4px; width: 25px; vertical-align: inherit;">Boston | 45 | 27 | 100 | 10 |
| <img src="https://a.espncdn.com/i/teamlogos/nhl/500/ott.png" style="padding: 0 4px; width: 25px; vertical-align: inherit;">Ottawa | 44 | 27 | 99 | 11 |
| <img src="https://a.espncdn.com/i/teamlogos/nhl/500/det.png" style="padding: 0 4px; width: 25px; vertical-align: inherit;">Detroit | 41 | 31 | 92 | 10 |
| <img src="https://a.espncdn.com/i/teamlogos/nhl/500/fla.png" style="padding: 0 4px; width: 25px; vertical-align: inherit;">Florida | 40 | 38 | 84 | 4 |
| <img src="https://a.espncdn.com/i/teamlogos/nhl/500/tor.png" style="padding: 0 4px; width: 25px; vertical-align: inherit;">Toronto | 32 | 36 | 78 | 14 |