
Vancouver Canucks at Minnesota Wild
· National Hockey League
2 - 5

Wild wrap up a playoff spot with 5-2 victory over the Canucks

Third in the Western Conference and the NHL's stacked Central Division, Minnesota secured the postseason spot in 75 games after getting in last season in the 82nd and final game before falling to Vegas in the first round.
Ryan Hartmman scored twice in the third to reach 20 goals, and Filip Gustavsson made 29 saves to help the Wild rebound from a 6-3 loss at Boston on Saturday.
Former Canucks defenseman Quinn Hughes had his 67th assist. He joined the Wild in a blockbuster trade in December that sent Marco Rossi, Zeev Buium, Liam Ohgren and a first-round pick in 2026 to Vancouver.
Tom Willander and Jake DeBrusk scored for NHL-worst Vancouver, and Nikita Tolopilo stopped 32 shots. The Canucks were coming off an 8-6 victory at NHL-leading Colorado on Wednesday night.
Boldy tied it at 2 on a wrist shot at 23 seconds of the second period, and Kaprizov followed on a snap shot at 06:08 of the period. Hartmman scored on a tip at 6:03 of the third and had an empty-netter.
The Wild are six points behind Dallas and 12 back of Colorado.
Wild: At Ottawa on Saturday.
Regular Season SeriesMIN wins series 2-1
Scoring Summary
 |
Goal | 1st Period 8:32 | Matt Boldy Goal (39) Wrist Shot, assists: Marcus Johansson (31), Joel Eriksson Ek (28) |
 |
Goal | 1st Period 16:00 | Tom Willander Goal (5) Wrist Shot, assists: Teddy Blueger (6), Max Sasson (6) |
|
Goal | 1st Period 16:42 | Jake DeBrusk Goal (18) Wrist Shot, assists: Filip Hronek (36), Elias Pettersson (33) |
|
Goal | 2nd Period 0:23 | Matt Boldy Goal (40) Wrist Shot, assists: none |
|
Goal | 2nd Period 6:08 | Kirill Kaprizov Goal (40) Snap Shot, assists: Mats Zuccarello (31) |
|
Goal | 3rd Period 6:03 | Ryan Hartman Goal (19) Tip-In, assists: Mats Zuccarello (32), Quinn Hughes (67) |
|
Goal | 3rd Period 18:52 | Ryan Hartman Goal (20) Wrist Shot, assists: Kirill Kaprizov (43), Matt Boldy (39) |
Statistics
 VAN VAN |
 MIN MIN |
|
|---|---|---|
| 11 | Blocked Shots | 19 |
| 22 | Hits | 17 |
| 4 | Takeaways | 2 |
| 33 | Shots | 39 |
| 1 | Power Play Goals | 0 |
| 2 | Power Play Opportunities | 2 |
| 50.0 | Power Play Percentage | 0.0 |
| 0 | Short Handed Goals | 0 |
| 0 | Shootout Goals | 0 |
| 35 | Faceoffs Won | 24 |
| 59.3 | Faceoff Win Percent | 40.7 |
| 16 | Giveaways | 18 |
| 2 | Total Penalties | 2 |
| 4 | Penalty Minutes | 4 |
 Minnesota Wild Injuries
| NAME, POS | STATUS | DATE |
|---|---|---|
| Zach Bogosian, D | Out | Jul 1 |
| Filip Gustavsson, G | Out | May 18 |
| Jonas Brodin, D | Out | May 13 |
| Joel Eriksson Ek, C | Out | May 13 |
| Charlie Stramel, C | Out | Apr 6 |
 Vancouver Canucks Injuries
| NAME, POS | STATUS | DATE |
|---|---|---|
| Evander Kane, LW | Out | Apr 14 |
| Thatcher Demko, G | Injured Reserve | Mar 3 |
| Jonathan Lekkerimaki, RW | Out | Feb 27 |
| Filip Chytil, C | Injured Reserve | Feb 25 |
| Derek Forbort, D | Injured Reserve | Oct 28 |
Game Information
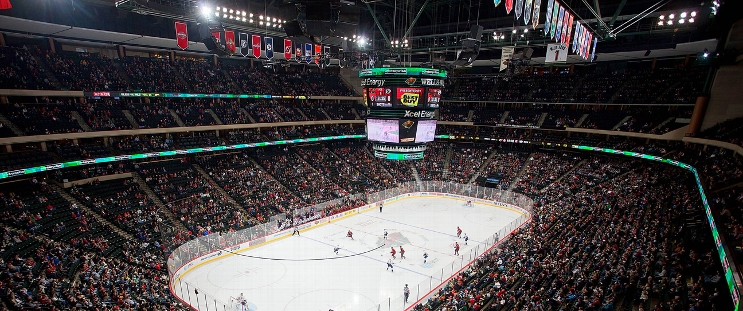 Grand Casino Arena
Location: Saint Paul, MN
Attendance: 19,156 | Capacity:
Location: Saint Paul, MN
Attendance: 19,156 | Capacity:
2025-26 Pacific Division Standings
| TEAM | W | L | PTS | OTL |
|---|---|---|---|---|
| <img src="https://a.espncdn.com/i/teamlogos/nhl/500/vgk.png" style="padding: 0 4px; width: 25px; vertical-align: inherit;">Vegas | 39 | 26 | 95 | 17 |
| <img src="https://a.espncdn.com/i/teamlogos/nhl/500/edm.png" style="padding: 0 4px; width: 25px; vertical-align: inherit;">Edmonton | 41 | 30 | 93 | 11 |
| <img src="https://a.espncdn.com/i/teamlogos/nhl/500/ana.png" style="padding: 0 4px; width: 25px; vertical-align: inherit;">Anaheim | 43 | 33 | 92 | 6 |
| <img src="https://a.espncdn.com/i/teamlogos/nhl/500/la.png" style="padding: 0 4px; width: 25px; vertical-align: inherit;">Los Angeles | 35 | 27 | 90 | 20 |
| <img src="https://a.espncdn.com/i/teamlogos/nhl/500/sj.png" style="padding: 0 4px; width: 25px; vertical-align: inherit;">San Jose | 39 | 35 | 86 | 8 |
| <img src="https://a.espncdn.com/i/teamlogos/nhl/500/sea.png" style="padding: 0 4px; width: 25px; vertical-align: inherit;">Seattle | 34 | 37 | 79 | 11 |
| <img src="https://a.espncdn.com/i/teamlogos/nhl/500/cgy.png" style="padding: 0 4px; width: 25px; vertical-align: inherit;">Calgary | 34 | 39 | 77 | 9 |
| <img src="https://a.espncdn.com/i/teamlogos/nhl/500/van.png" style="padding: 0 4px; width: 25px; vertical-align: inherit;">Vancouver | 25 | 49 | 58 | 8 |
2025-26 Central Division Standings
| TEAM | W | L | PTS | OTL |
|---|---|---|---|---|
| <img src="https://a.espncdn.com/i/teamlogos/nhl/500/col.png" style="padding: 0 4px; width: 25px; vertical-align: inherit;">Colorado | 55 | 16 | 121 | 11 |
| <img src="https://a.espncdn.com/i/teamlogos/nhl/500/dal.png" style="padding: 0 4px; width: 25px; vertical-align: inherit;">Dallas | 50 | 20 | 112 | 12 |
| <img src="https://a.espncdn.com/i/teamlogos/nhl/500/min.png" style="padding: 0 4px; width: 25px; vertical-align: inherit;">Minnesota | 46 | 24 | 104 | 12 |
| <img src="https://a.espncdn.com/i/teamlogos/nhl/500/uta.png" style="padding: 0 4px; width: 25px; vertical-align: inherit;">Utah | 43 | 33 | 92 | 6 |
| <img src="https://a.espncdn.com/i/teamlogos/nhl/500/stl.png" style="padding: 0 4px; width: 25px; vertical-align: inherit;">St. Louis | 37 | 33 | 86 | 12 |
| <img src="https://a.espncdn.com/i/teamlogos/nhl/500/nsh.png" style="padding: 0 4px; width: 25px; vertical-align: inherit;">Nashville | 38 | 34 | 86 | 10 |
| <img src="https://a.espncdn.com/i/teamlogos/nhl/500/wpg.png" style="padding: 0 4px; width: 25px; vertical-align: inherit;">Winnipeg | 35 | 35 | 82 | 12 |
| <img src="https://a.espncdn.com/i/teamlogos/nhl/500/chi.png" style="padding: 0 4px; width: 25px; vertical-align: inherit;">Chicago | 29 | 39 | 72 | 14 |