
Washington Capitals at New York Rangers
· National Hockey League
1 - 8

Capitals get blown out 8-1 by the Rangers in a game crucial to their playoff hopes

They now face a daunting task to get in: three points back with four games left to play. The Columbus Blue Jackets, New York Islanders and Philadelphia Flyers are ahead of them in the chase for third in the Metropolitan Division, with those teams plus the Detroit Red Wings and Ottawa Senators also in the way for the East's second and final wild card spot.
That precarious position made this close to a must-win game for Washington, and it got off to a rough start. Former Capitals winger Conor Sheary scored 23 seconds in against Lindgren, who was making his first start since March 12 after Logan Thompson played the previous 10 games.
After going into the first intermission tied, following a breakaway goal from Connor McMichael, the bottom fell out in the second period.
A second consecutive delay of game penalty for putting the puck over the glass 7 seconds after the first expired paved the way for a Rangers power-play goal when Mika Zibanejad's shot banked in off J.T. Miller's left skate. Will Cuylle scored twice over the ensuing six minutes, and goals by Adam Sykora and Adam Fox put the deficit out of reach.
Cuylle completed his first NHL hat trick with 31.5 seconds left, Vincent Trocheck scored earlier in the third and Igor Shesterkin made 20 saves for the Rangers, who won for the fifth time in six home games. They had just nine victories at Madison Square Garden in their first 34 before this home stand began.
Rangers: Host the playoff-bound Buffalo Sabres on Wednesday in their home finale.
Regular Season SeriesSeries tied 2-2
Scoring Summary
 |
Goal | 1st Period 0:23 | Conor Sheary Goal (7) Snap Shot, assists: Tye Kartye (13), Adam Fox (41) |
 |
Goal | 1st Period 13:45 | Connor McMichael Goal (12) Snap Shot, assists: Tom Wilson (29), Martin Fehervary (19) |
|
Goal | 2nd Period 3:07 | J.T. Miller Goal (17) Deflected, assists: Mika Zibanejad (40), Adam Fox (42) |
|
Goal | 2nd Period 5:53 | Will Cuylle Goal (18) Tip-In, assists: Braden Schneider (16), Jonny Brodzinski (10) |
|
Goal | 2nd Period 8:33 | Will Cuylle Goal (19) Wrist Shot, assists: Vincent Trocheck (36), Vladislav Gavrikov (20) |
|
Goal | 2nd Period 13:22 | Adam Sykora Goal (3) Snap Shot, assists: Noah Laba (14), Jaroslav Chmelar (2) |
|
Goal | 2nd Period 18:27 | Adam Fox Goal (8) Snap Shot, assists: Mika Zibanejad (41), J.T. Miller (33) |
|
Goal | 3rd Period 2:27 | Vincent Trocheck Goal (16) Wrist Shot, assists: none |
|
Goal | 3rd Period 19:28 | Will Cuylle Goal (20) Snap Shot, assists: Mika Zibanejad (42), Alexis Lafrenière (31) |
Statistics
 WSH WSH |
 NYR NYR |
|
|---|---|---|
| 20 | Blocked Shots | 13 |
| 26 | Hits | 23 |
| 4 | Takeaways | 5 |
| 21 | Shots | 33 |
| 0 | Power Play Goals | 2 |
| 3 | Power Play Opportunities | 4 |
| 0.0 | Power Play Percentage | 50.0 |
| 0 | Short Handed Goals | 0 |
| 0 | Shootout Goals | 0 |
| 21 | Faceoffs Won | 39 |
| 35.0 | Faceoff Win Percent | 65.0 |
| 10 | Giveaways | 17 |
| 7 | Total Penalties | 6 |
| 23 | Penalty Minutes | 21 |
 New York Rangers Injuries
| NAME, POS | STATUS | DATE |
|---|---|---|
| Matt Rempe, C | Injured Reserve | Mar 23 |
 Washington Capitals Injuries
| NAME, POS | STATUS | DATE |
|---|---|---|
| Jordan Kyrou, RW | Out | Jun 23 |
| Rasmus Sandin, D | Out | Apr 22 |
| Pierre-Luc Dubois, LW | Out | Apr 16 |
| Charlie Lindgren, G | Out | Apr 14 |
| Eriks Mateiko, LW | Out | Jan 13 |
Game Information
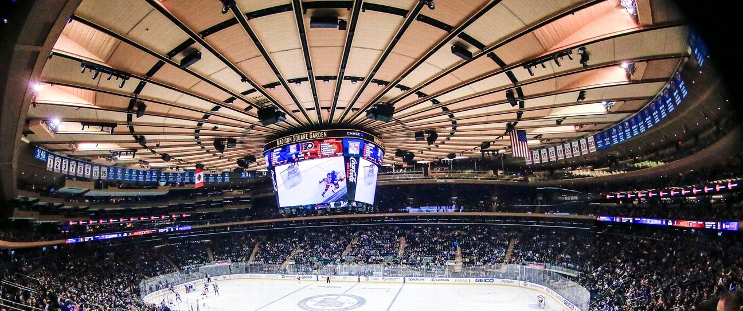 Madison Square Garden
Location: New York, NY
Attendance: 17,335 | Capacity:
Location: New York, NY
Attendance: 17,335 | Capacity:
2025-26 Metropolitan Division Standings
| TEAM | W | L | PTS | OTL |
|---|---|---|---|---|
| <img src="https://a.espncdn.com/i/teamlogos/nhl/500/car.png" style="padding: 0 4px; width: 25px; vertical-align: inherit;">Carolina | 53 | 22 | 113 | 7 |
| <img src="https://a.espncdn.com/i/teamlogos/nhl/500/pit.png" style="padding: 0 4px; width: 25px; vertical-align: inherit;">Pittsburgh | 41 | 25 | 98 | 16 |
| <img src="https://a.espncdn.com/i/teamlogos/nhl/500/phi.png" style="padding: 0 4px; width: 25px; vertical-align: inherit;">Philadelphia | 43 | 27 | 98 | 12 |
| <img src="https://a.espncdn.com/i/teamlogos/nhl/500/wsh.png" style="padding: 0 4px; width: 25px; vertical-align: inherit;">Washington | 43 | 30 | 95 | 9 |
| <img src="https://a.espncdn.com/i/teamlogos/nhl/500/cbj.png" style="padding: 0 4px; width: 25px; vertical-align: inherit;">Columbus | 40 | 30 | 92 | 12 |
| <img src="https://a.espncdn.com/i/teamlogos/nhl/500/nyi.png" style="padding: 0 4px; width: 25px; vertical-align: inherit;">NY Islanders | 43 | 34 | 91 | 5 |
| <img src="https://a.espncdn.com/i/teamlogos/nhl/500/nj.png" style="padding: 0 4px; width: 25px; vertical-align: inherit;">New Jersey | 42 | 37 | 87 | 3 |
| <img src="https://a.espncdn.com/i/teamlogos/nhl/500/nyr.png" style="padding: 0 4px; width: 25px; vertical-align: inherit;">NY Rangers | 34 | 39 | 77 | 9 |