
Columbus Blue Jackets at Detroit Red Wings
· National Hockey League
4 - 3

Zach Werenski scores in shootout to lead Blue Jackets over Red Wings 4-3

Adam Fantilli tied the game with 17 seconds left, Danton Heinen also scored and Werenski also added a goal and an assist in regulation. Jet Greaves stopped 34 shots and assisted on Werenski's goal for his first career point.
Werenski notched his 26th multipoint game of the year, setting a single-season record for the Blue Jackets.
Justin Faulk scored twice, Dylan Larkin added one goal, and John Gibson had 32 saves for the Red Wings.
Red Wings center Michael Rasmussen left in the second period with a lower-body injury and did not return.
The Blue Jackets blocked 21 shots and the Red Wings blocked 25.
Red Wings: Host the Philadelphia Flyers on Thursday.
Regular Season SeriesCBJ win series 2-1
Scoring Summary
 |
Goal | 1st Period 2:06 | Danton Heinen Goal (6) Snap Shot, assists: Mason Marchment (24) |
 |
Goal | 1st Period 10:27 | Dylan Larkin Goal (31) Wrist Shot, assists: Patrick Kane (38), Moritz Seider (46) |
|
Goal | 2nd Period 6:27 | Justin Faulk Goal (13) Wrist Shot, assists: Dylan Larkin (30), Ben Chiarot (8) |
|
Goal | 2nd Period 10:59 | Zach Werenski Goal (22) Wrist Shot, assists: Denton Mateychuk (18), Jet Greaves (1) |
|
Goal | 3rd Period 15:14 | Justin Faulk Goal (14) Slap Shot, assists: Alex DeBrincat (43), Andrew Copp (34) |
|
Goal | 3rd Period 19:43 | Adam Fantilli Goal (23) Slap Shot, assists: Zach Werenski (58), Kirill Marchenko (39) |
|
Goal | 5 0:00 | Kent Johnson Goal Wrist Shot |
|
Goal | 5 0:00 | Patrick Kane Goal Backhand |
|
Goal | 5 0:00 | Alex DeBrincat Goal Snap Shot |
|
Goal | 5 0:00 | Charlie Coyle Goal Wrist Shot |
|
Goal | 5 0:00 | Zach Werenski Goal Wrist Shot |
Statistics
 CBJ CBJ |
 DET DET |
|
|---|---|---|
| 23 | Blocked Shots | 25 |
| 20 | Hits | 26 |
| 6 | Takeaways | 5 |
| 35 | Shots | 37 |
| 1 | Power Play Goals | 1 |
| 4 | Power Play Opportunities | 1 |
| 25.0 | Power Play Percentage | 100.0 |
| 0 | Short Handed Goals | 0 |
| 0 | Shootout Goals | 0 |
| 34 | Faceoffs Won | 29 |
| 54.0 | Faceoff Win Percent | 46.0 |
| 15 | Giveaways | 14 |
| 2 | Total Penalties | 4 |
| 4 | Penalty Minutes | 8 |
 Detroit Red Wings Injuries
| NAME, POS | STATUS | DATE |
|---|---|---|
| Viktor Arvidsson, LW | Out | Jul 1 |
| Mason Appleton, C | Out | Apr 15 |
| Michael Rasmussen, C | Out | Apr 7 |
 Columbus Blue Jackets Injuries
| NAME, POS | STATUS | DATE |
|---|
Game Information
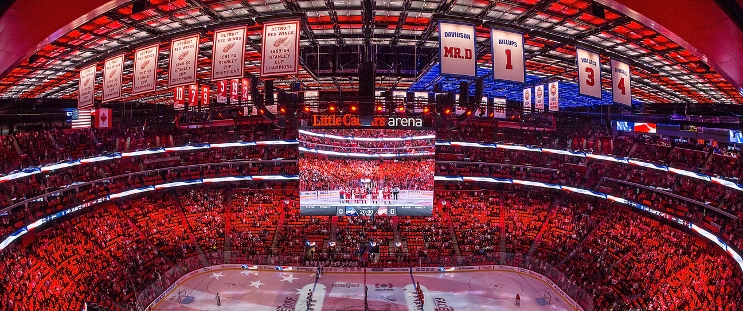 Little Caesars Arena
Location: Detroit, MI
Attendance: 17,687 | Capacity:
Location: Detroit, MI
Attendance: 17,687 | Capacity:
2025-26 Metropolitan Division Standings
| TEAM | W | L | PTS | OTL |
|---|---|---|---|---|
| <img src="https://a.espncdn.com/i/teamlogos/nhl/500/car.png" style="padding: 0 4px; width: 25px; vertical-align: inherit;">Carolina | 53 | 22 | 113 | 7 |
| <img src="https://a.espncdn.com/i/teamlogos/nhl/500/pit.png" style="padding: 0 4px; width: 25px; vertical-align: inherit;">Pittsburgh | 41 | 25 | 98 | 16 |
| <img src="https://a.espncdn.com/i/teamlogos/nhl/500/phi.png" style="padding: 0 4px; width: 25px; vertical-align: inherit;">Philadelphia | 43 | 27 | 98 | 12 |
| <img src="https://a.espncdn.com/i/teamlogos/nhl/500/wsh.png" style="padding: 0 4px; width: 25px; vertical-align: inherit;">Washington | 43 | 30 | 95 | 9 |
| <img src="https://a.espncdn.com/i/teamlogos/nhl/500/cbj.png" style="padding: 0 4px; width: 25px; vertical-align: inherit;">Columbus | 40 | 30 | 92 | 12 |
| <img src="https://a.espncdn.com/i/teamlogos/nhl/500/nyi.png" style="padding: 0 4px; width: 25px; vertical-align: inherit;">NY Islanders | 43 | 34 | 91 | 5 |
| <img src="https://a.espncdn.com/i/teamlogos/nhl/500/nj.png" style="padding: 0 4px; width: 25px; vertical-align: inherit;">New Jersey | 42 | 37 | 87 | 3 |
| <img src="https://a.espncdn.com/i/teamlogos/nhl/500/nyr.png" style="padding: 0 4px; width: 25px; vertical-align: inherit;">NY Rangers | 34 | 39 | 77 | 9 |
2025-26 Atlantic Division Standings
| TEAM | W | L | PTS | OTL |
|---|---|---|---|---|
| <img src="https://a.espncdn.com/i/teamlogos/nhl/500/buf.png" style="padding: 0 4px; width: 25px; vertical-align: inherit;">Buffalo | 50 | 23 | 109 | 9 |
| <img src="https://a.espncdn.com/i/teamlogos/nhl/500/tb.png" style="padding: 0 4px; width: 25px; vertical-align: inherit;">Tampa Bay | 50 | 26 | 106 | 6 |
| <img src="https://a.espncdn.com/i/teamlogos/nhl/500/mtl.png" style="padding: 0 4px; width: 25px; vertical-align: inherit;">Montreal | 48 | 24 | 106 | 10 |
| <img src="https://a.espncdn.com/i/teamlogos/nhl/500/bos.png" style="padding: 0 4px; width: 25px; vertical-align: inherit;">Boston | 45 | 27 | 100 | 10 |
| <img src="https://a.espncdn.com/i/teamlogos/nhl/500/ott.png" style="padding: 0 4px; width: 25px; vertical-align: inherit;">Ottawa | 44 | 27 | 99 | 11 |
| <img src="https://a.espncdn.com/i/teamlogos/nhl/500/det.png" style="padding: 0 4px; width: 25px; vertical-align: inherit;">Detroit | 41 | 31 | 92 | 10 |
| <img src="https://a.espncdn.com/i/teamlogos/nhl/500/fla.png" style="padding: 0 4px; width: 25px; vertical-align: inherit;">Florida | 40 | 38 | 84 | 4 |
| <img src="https://a.espncdn.com/i/teamlogos/nhl/500/tor.png" style="padding: 0 4px; width: 25px; vertical-align: inherit;">Toronto | 32 | 36 | 78 | 14 |