
Seattle Kraken at Minnesota Wild
· National Hockey League
2 - 5

Wild beat skidding Kraken 5-2 for 4th straight win, setting up showdown with Stars

Marcus Johansson also had a goal and an assist for the Wild, who won their fourth straight game and swept the season series from Seattle. Marcus Foligno scored the tying goal early in the second, and Joel Eriksson Ek added an empty-net goal and two assists.
After a shaky start, Jesper Wallstedt made 25 saves to earn the win.
Minnesota trails Dallas by two points for second place in the Central Division and Western Conference heading into their showdown Thursday in Texas. Each team has four regular-season games remaining before they square off in a first-round playoff series, with home-ice advantage still up for grabs.
Brandon Montour and Adam Larsson scored in the first period for Seattle, which has lost six in a row.
Two goals were reviewed in this one — and both decisions went Minnesota's way.
The first came on Boldy’s first-period goal. The play was originally ruled no goal as it appeared Boldy batted in the puck with a high stick. But video review overturned the call, and Boldy’s 42nd of the season tied it at 1.
In the second, Seattle appeared to tie the game on a shot by Jaden Schwartz — but the goal was reviewed and overturned. Officials ruled former Wild forward Frederick Gaudreau held Wallstedt’s glove hand down with his stick, preventing him from making the save.
Johansson’s third-period goal made it 4-2 and was the 200th of his career. Johansson took a perfect pass from Boldy right on the doorstep to beat Kraken goalie Joey Daccord, who finished with 24 saves.
Wild: At the Dallas Stars on Thursday.
Regular Season SeriesMIN wins series 3-0
Scoring Summary
 |
Goal | 1st Period 10:23 | Brandon Montour Goal (11) Slap Shot, assists: Kaapo Kakko (25), Jaden Schwartz (13) |
 |
Goal | 1st Period 11:57 | Matt Boldy Goal (42) Tip-In, assists: Joel Eriksson Ek (31), Marcus Johansson (32) |
|
Goal | 1st Period 13:10 | Adam Larsson Goal (6) Snap Shot, assists: Chandler Stephenson (31) |
|
Goal | 2nd Period 0:38 | Marcus Foligno Goal (8) Wrist Shot, assists: Yakov Trenin (16) |
|
Goal | 2nd Period 12:46 | Vladimir Tarasenko Goal (23) Wrist Shot, assists: Ryan Hartman (20), Jared Spurgeon (15) |
|
Goal | 3rd Period 6:49 | Marcus Johansson Goal (15) Wrist Shot, assists: Matt Boldy (41), Joel Eriksson Ek (32) |
|
Goal | 3rd Period 17:17 | Joel Eriksson Ek Goal (19) Wrist Shot, assists: none |
Statistics
 SEA SEA |
 MIN MIN |
|
|---|---|---|
| 11 | Blocked Shots | 18 |
| 9 | Hits | 15 |
| 3 | Takeaways | 5 |
| 27 | Shots | 29 |
| 0 | Power Play Goals | 0 |
| 3 | Power Play Opportunities | 1 |
| 0.0 | Power Play Percentage | 0.0 |
| 0 | Short Handed Goals | 0 |
| 0 | Shootout Goals | 0 |
| 24 | Faceoffs Won | 24 |
| 50.0 | Faceoff Win Percent | 50.0 |
| 15 | Giveaways | 20 |
| 3 | Total Penalties | 5 |
| 9 | Penalty Minutes | 13 |
 Minnesota Wild Injuries
| NAME, POS | STATUS | DATE |
|---|---|---|
| Zach Bogosian, D | Out | Jul 1 |
| Filip Gustavsson, G | Out | May 18 |
| Jonas Brodin, D | Out | May 13 |
| Joel Eriksson Ek, C | Out | May 13 |
| Charlie Stramel, C | Out | Apr 6 |
 Seattle Kraken Injuries
| NAME, POS | STATUS | DATE |
|---|---|---|
| Jared McCann, LW | Out | Apr 17 |
| Joey Daccord, G | Out | Apr 16 |
Game Information
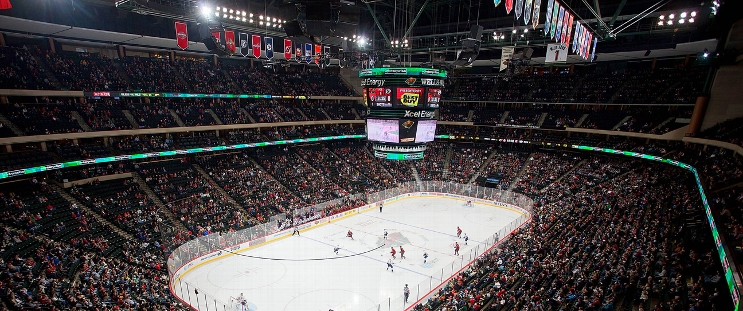 Grand Casino Arena
Location: Saint Paul, MN
Attendance: 19,089 | Capacity:
Location: Saint Paul, MN
Attendance: 19,089 | Capacity:
2025-26 Pacific Division Standings
| TEAM | W | L | PTS | OTL |
|---|---|---|---|---|
| <img src="https://a.espncdn.com/i/teamlogos/nhl/500/vgk.png" style="padding: 0 4px; width: 25px; vertical-align: inherit;">Vegas | 39 | 26 | 95 | 17 |
| <img src="https://a.espncdn.com/i/teamlogos/nhl/500/edm.png" style="padding: 0 4px; width: 25px; vertical-align: inherit;">Edmonton | 41 | 30 | 93 | 11 |
| <img src="https://a.espncdn.com/i/teamlogos/nhl/500/ana.png" style="padding: 0 4px; width: 25px; vertical-align: inherit;">Anaheim | 43 | 33 | 92 | 6 |
| <img src="https://a.espncdn.com/i/teamlogos/nhl/500/la.png" style="padding: 0 4px; width: 25px; vertical-align: inherit;">Los Angeles | 35 | 27 | 90 | 20 |
| <img src="https://a.espncdn.com/i/teamlogos/nhl/500/sj.png" style="padding: 0 4px; width: 25px; vertical-align: inherit;">San Jose | 39 | 35 | 86 | 8 |
| <img src="https://a.espncdn.com/i/teamlogos/nhl/500/sea.png" style="padding: 0 4px; width: 25px; vertical-align: inherit;">Seattle | 34 | 37 | 79 | 11 |
| <img src="https://a.espncdn.com/i/teamlogos/nhl/500/cgy.png" style="padding: 0 4px; width: 25px; vertical-align: inherit;">Calgary | 34 | 39 | 77 | 9 |
| <img src="https://a.espncdn.com/i/teamlogos/nhl/500/van.png" style="padding: 0 4px; width: 25px; vertical-align: inherit;">Vancouver | 25 | 49 | 58 | 8 |
2025-26 Central Division Standings
| TEAM | W | L | PTS | OTL |
|---|---|---|---|---|
| <img src="https://a.espncdn.com/i/teamlogos/nhl/500/col.png" style="padding: 0 4px; width: 25px; vertical-align: inherit;">Colorado | 55 | 16 | 121 | 11 |
| <img src="https://a.espncdn.com/i/teamlogos/nhl/500/dal.png" style="padding: 0 4px; width: 25px; vertical-align: inherit;">Dallas | 50 | 20 | 112 | 12 |
| <img src="https://a.espncdn.com/i/teamlogos/nhl/500/min.png" style="padding: 0 4px; width: 25px; vertical-align: inherit;">Minnesota | 46 | 24 | 104 | 12 |
| <img src="https://a.espncdn.com/i/teamlogos/nhl/500/uta.png" style="padding: 0 4px; width: 25px; vertical-align: inherit;">Utah | 43 | 33 | 92 | 6 |
| <img src="https://a.espncdn.com/i/teamlogos/nhl/500/stl.png" style="padding: 0 4px; width: 25px; vertical-align: inherit;">St. Louis | 37 | 33 | 86 | 12 |
| <img src="https://a.espncdn.com/i/teamlogos/nhl/500/nsh.png" style="padding: 0 4px; width: 25px; vertical-align: inherit;">Nashville | 38 | 34 | 86 | 10 |
| <img src="https://a.espncdn.com/i/teamlogos/nhl/500/wpg.png" style="padding: 0 4px; width: 25px; vertical-align: inherit;">Winnipeg | 35 | 35 | 82 | 12 |
| <img src="https://a.espncdn.com/i/teamlogos/nhl/500/chi.png" style="padding: 0 4px; width: 25px; vertical-align: inherit;">Chicago | 29 | 39 | 72 | 14 |