
Philadelphia Flyers at Detroit Red Wings
· National Hockey League
3 - 6

Larkin's hat trick, Seider's career night lead Red Wings to crucial win over Flyers, 6-2

Moritz Seider had a career-high five points with a goal and four assists while Patrick Kane had a goal and two assists.
The win gives the Red Wings 91 points with three games left. They trail the Ottawa Senators by three points for the second Eastern Conference wildcard, and the Senators hold the regulation-wins tiebreaker.
The Flyers, who had won three straight, are still on 92 points, one ahead of the New York Islanders for third place in the Metro.
Porter Martone had a goal and an assist for Philadelphia and has six points, including four assists, in his first six NHL games.
Alex DeBrincat put the Red Wings ahead with a power-play goal at 2:29 of the first period. DeBrincat took a pass from Lucas Raymond in front of the net and flipped a back-hand shot over the goalie's right shoulder for his 40th goal. He's the first Red Wing with a 40-goal season since Marian Hossa did it in 2008-09.
Martone helped the Flyers tie the game at 13:24, firing a low shot that Christian Dvorak deflected past John Gibson.
Detroit went on a 5-on-3 power play in the first 30 seconds of the second period and Seider made it 2-1 at 32 seconds, blowing a slap shot past Dan Vladar for his 10th goal of the season.
Larkin then made it 3-1 at 1:50, taking a pass from Kane and beating Vladar with a wrist shot from the low slot.
The Red Wings gave Philadelphia a chance to get back into the game, taking a pair of penalties that allowed the Flyers 28 seconds of their own 5-on-3 advantage.
Martone pulled the Flyers within 4-2 at 9:25 with a power-play goal.
Moments later, Gibson left the game for Cam Talbot, possibly due to a collision with Owen Tippett early in the period.
Luke Glendening finished the scoring against his former team at 18:09.
Red Wings: Host New Jersey on Saturday.
Regular Season SeriesDET wins series 2-1
Scoring Summary
 |
Goal | 1st Period 2:28 | Alex DeBrincat Goal (40) Backhand, assists: Lucas Raymond (49), Moritz Seider (47) |
 |
Goal | 1st Period 13:24 | Christian Dvorak Goal (18) Tip-In, assists: Porter Martone (4), Travis Konecny (40) |
|
Goal | 2nd Period 0:32 | Moritz Seider Goal (10) Slap Shot, assists: Patrick Kane (39), Dylan Larkin (31) |
|
Goal | 2nd Period 1:50 | Dylan Larkin Goal (32) Wrist Shot, assists: Patrick Kane (40), Moritz Seider (48) |
|
Goal | 2nd Period 4:56 | Dylan Larkin Goal (33) Wrist Shot, assists: Albert Johansson (8) |
|
Goal | 2nd Period 9:25 | Porter Martone Goal (2) Wrist Shot, assists: Trevor Zegras (41), Jamie Drysdale (24) |
|
Goal | 3rd Period 7:01 | Patrick Kane Goal (16) Snap Shot, assists: Simon Edvinsson (16), Moritz Seider (49) |
|
Goal | 3rd Period 11:39 | Dylan Larkin Goal (34) Snap Shot, assists: Moritz Seider (50), Lucas Raymond (50) |
|
Goal | 3rd Period 18:09 | Luke Glendening Goal (2) Tip-In, assists: Denver Barkey (10), Sean Couturier (23) |
Statistics
 PHI PHI |
 DET DET |
|
|---|---|---|
| 13 | Blocked Shots | 12 |
| 30 | Hits | 20 |
| 3 | Takeaways | 4 |
| 27 | Shots | 22 |
| 1 | Power Play Goals | 3 |
| 6 | Power Play Opportunities | 4 |
| 16.7 | Power Play Percentage | 75.0 |
| 0 | Short Handed Goals | 1 |
| 0 | Shootout Goals | 0 |
| 26 | Faceoffs Won | 28 |
| 48.1 | Faceoff Win Percent | 51.9 |
| 12 | Giveaways | 9 |
| 6 | Total Penalties | 8 |
| 12 | Penalty Minutes | 16 |
 Detroit Red Wings Injuries
| NAME, POS | STATUS | DATE |
|---|---|---|
| Viktor Arvidsson, LW | Out | Jul 1 |
| Mason Appleton, C | Out | Apr 15 |
| Michael Rasmussen, C | Out | Apr 7 |
 Philadelphia Flyers Injuries
| NAME, POS | STATUS | DATE |
|---|---|---|
| Nikita Grebenkin, RW | Out | May 14 |
| Noah Cates, LW | Out | May 12 |
| Owen Tippett, RW | Out | May 11 |
| Ty Murchison, D | Out | Feb 3 |
Game Information
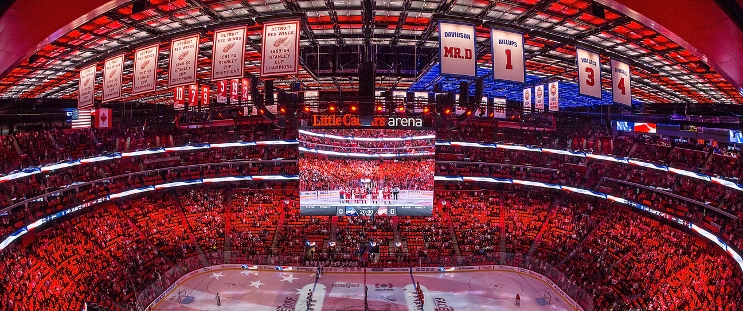 Little Caesars Arena
Location: Detroit, MI
Attendance: 18,197 | Capacity:
Location: Detroit, MI
Attendance: 18,197 | Capacity:
2025-26 Metropolitan Division Standings
| TEAM | W | L | PTS | OTL |
|---|---|---|---|---|
| <img src="https://a.espncdn.com/i/teamlogos/nhl/500/car.png" style="padding: 0 4px; width: 25px; vertical-align: inherit;">Carolina | 53 | 22 | 113 | 7 |
| <img src="https://a.espncdn.com/i/teamlogos/nhl/500/pit.png" style="padding: 0 4px; width: 25px; vertical-align: inherit;">Pittsburgh | 41 | 25 | 98 | 16 |
| <img src="https://a.espncdn.com/i/teamlogos/nhl/500/phi.png" style="padding: 0 4px; width: 25px; vertical-align: inherit;">Philadelphia | 43 | 27 | 98 | 12 |
| <img src="https://a.espncdn.com/i/teamlogos/nhl/500/wsh.png" style="padding: 0 4px; width: 25px; vertical-align: inherit;">Washington | 43 | 30 | 95 | 9 |
| <img src="https://a.espncdn.com/i/teamlogos/nhl/500/cbj.png" style="padding: 0 4px; width: 25px; vertical-align: inherit;">Columbus | 40 | 30 | 92 | 12 |
| <img src="https://a.espncdn.com/i/teamlogos/nhl/500/nyi.png" style="padding: 0 4px; width: 25px; vertical-align: inherit;">NY Islanders | 43 | 34 | 91 | 5 |
| <img src="https://a.espncdn.com/i/teamlogos/nhl/500/nj.png" style="padding: 0 4px; width: 25px; vertical-align: inherit;">New Jersey | 42 | 37 | 87 | 3 |
| <img src="https://a.espncdn.com/i/teamlogos/nhl/500/nyr.png" style="padding: 0 4px; width: 25px; vertical-align: inherit;">NY Rangers | 34 | 39 | 77 | 9 |
2025-26 Atlantic Division Standings
| TEAM | W | L | PTS | OTL |
|---|---|---|---|---|
| <img src="https://a.espncdn.com/i/teamlogos/nhl/500/buf.png" style="padding: 0 4px; width: 25px; vertical-align: inherit;">Buffalo | 50 | 23 | 109 | 9 |
| <img src="https://a.espncdn.com/i/teamlogos/nhl/500/tb.png" style="padding: 0 4px; width: 25px; vertical-align: inherit;">Tampa Bay | 50 | 26 | 106 | 6 |
| <img src="https://a.espncdn.com/i/teamlogos/nhl/500/mtl.png" style="padding: 0 4px; width: 25px; vertical-align: inherit;">Montreal | 48 | 24 | 106 | 10 |
| <img src="https://a.espncdn.com/i/teamlogos/nhl/500/bos.png" style="padding: 0 4px; width: 25px; vertical-align: inherit;">Boston | 45 | 27 | 100 | 10 |
| <img src="https://a.espncdn.com/i/teamlogos/nhl/500/ott.png" style="padding: 0 4px; width: 25px; vertical-align: inherit;">Ottawa | 44 | 27 | 99 | 11 |
| <img src="https://a.espncdn.com/i/teamlogos/nhl/500/det.png" style="padding: 0 4px; width: 25px; vertical-align: inherit;">Detroit | 41 | 31 | 92 | 10 |
| <img src="https://a.espncdn.com/i/teamlogos/nhl/500/fla.png" style="padding: 0 4px; width: 25px; vertical-align: inherit;">Florida | 40 | 38 | 84 | 4 |
| <img src="https://a.espncdn.com/i/teamlogos/nhl/500/tor.png" style="padding: 0 4px; width: 25px; vertical-align: inherit;">Toronto | 32 | 36 | 78 | 14 |