
Toronto Maple Leafs at New York Islanders
· National Hockey League
3 - 5

Matthew Schaefer matches record for goals by rookie defenseman as Islanders top Leafs 5-3

Cal Ritchie had a goal and an assist, and Ilya Sorokin finished with 13 saves as the Islanders snapped a four-game skid. Brayden Schenn, Jean-Gabriel Pageau and Emil Heineman also scored, and Tony DeAngelo added two assists.
DeBoer was hired Sunday after the Islanders fired Patrick Roy amid a late-season slide that saw the team lose seven of 10 games. New York remains in contention for a wild-card playoff spot, trailing Ottawa by three points with three games left.
Steven Lorentz, Easton Cowan and Morgan Rielly scored for Toronto. Artur Akhtyamov made 39 saves for the Maple Leafs, who lost their fifth straight.
Schaefer’s goal midway through the second period was his 23rd of the season to match Hall of Famer Brian Leetch’s record for a rookie defender, set in 1988-89 for the New York Rangers. His shot through Akhtyamov’s legs put the Islanders ahead 3-2.
Heineman scored late in the second for a two-goal advantage, and Ritchie added a power-play goal midway through the third period to put the game out of reach.
New York scored twice in the first five minutes to open the DeBoer era.
Schenn opened the scoring at 2:08 of the first period, finishing a feed from Ritchie on a delayed penalty. Pageau added a goal later in the period, depositing his own rebound to extend the Islanders’ lead to 2-0.
Islanders: Host Ottawa on Saturday.
Regular Season SeriesNYI win series 3-0
Scoring Summary
 |
Goal | 1st Period 2:08 | Brayden Schenn Goal (18) Snap Shot, assists: Calum Ritchie (17), Bo Horvat (26) |
|
Goal | 1st Period 4:55 | Jean-Gabriel Pageau Goal (17) Snap Shot, assists: Max Shabanov (13), Adam Pelech (12) |
 |
Goal | 1st Period 5:11 | Steven Lorentz Goal (7) Wrist Shot, assists: none |
|
Goal | 2nd Period 1:57 | Easton Cowan Goal (11) Wrist Shot, assists: John Tavares (39), Oliver Ekman-Larsson (31) |
|
Goal | 2nd Period 9:39 | Matthew Schaefer Goal (23) Wrist Shot, assists: Tony DeAngelo (29), Ondrej Palat (10) |
|
Goal | 2nd Period 16:44 | Emil Heineman Goal (22) Snap Shot, assists: Mathew Barzal (52), Tony DeAngelo (30) |
|
Goal | 3rd Period 10:20 | Calum Ritchie Goal (13) Snap Shot, assists: none |
|
Goal | 3rd Period 14:04 | Morgan Rielly Goal (11) Wrist Shot, assists: Matias Maccelli (25), Luke Haymes (1) |
Statistics
 TOR TOR |
 NYI NYI |
|
|---|---|---|
| 13 | Blocked Shots | 11 |
| 21 | Hits | 24 |
| 3 | Takeaways | 3 |
| 16 | Shots | 44 |
| 1 | Power Play Goals | 2 |
| 1 | Power Play Opportunities | 5 |
| 100.0 | Power Play Percentage | 40.0 |
| 0 | Short Handed Goals | 0 |
| 0 | Shootout Goals | 0 |
| 31 | Faceoffs Won | 36 |
| 46.3 | Faceoff Win Percent | 53.7 |
| 12 | Giveaways | 16 |
| 6 | Total Penalties | 1 |
| 20 | Penalty Minutes | 2 |
 New York Islanders Injuries
| NAME, POS | STATUS | DATE |
|---|---|---|
| Mathew Barzal, C | Out | May 12 |
| Semyon Varlamov, G | Injured Reserve | Apr 19 |
| Kyle Palmieri, C | Injured Reserve | Apr 15 |
| Ryan Pulock, D | Out | Apr 14 |
| Alexander Romanov, D | Injured Reserve | Apr 12 |
 Toronto Maple Leafs Injuries
| NAME, POS | STATUS | DATE |
|---|---|---|
| Zack MacEwen, C | Injured Reserve | Jul 1 |
| Max Domi, C | Out | May 25 |
| Calle Jarnkrok, C | Out | Apr 15 |
| Dakota Joshua, C | Out | Apr 11 |
| Auston Matthews, C | Out | Mar 19 |
Game Information
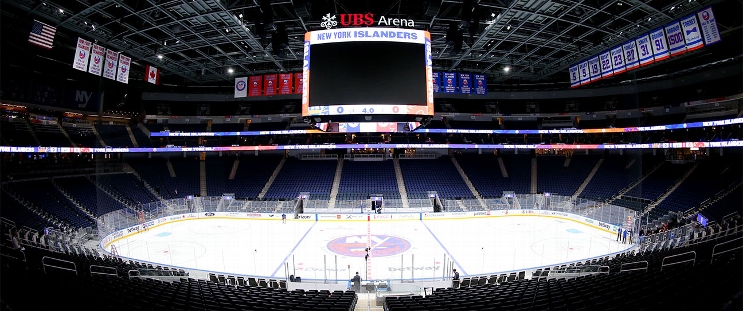 UBS Arena
Location: Elmont, NY
Attendance: 17,255 | Capacity:
Location: Elmont, NY
Attendance: 17,255 | Capacity:
2025-26 Atlantic Division Standings
| TEAM | W | L | PTS | OTL |
|---|---|---|---|---|
| <img src="https://a.espncdn.com/i/teamlogos/nhl/500/buf.png" style="padding: 0 4px; width: 25px; vertical-align: inherit;">Buffalo | 50 | 23 | 109 | 9 |
| <img src="https://a.espncdn.com/i/teamlogos/nhl/500/tb.png" style="padding: 0 4px; width: 25px; vertical-align: inherit;">Tampa Bay | 50 | 26 | 106 | 6 |
| <img src="https://a.espncdn.com/i/teamlogos/nhl/500/mtl.png" style="padding: 0 4px; width: 25px; vertical-align: inherit;">Montreal | 48 | 24 | 106 | 10 |
| <img src="https://a.espncdn.com/i/teamlogos/nhl/500/bos.png" style="padding: 0 4px; width: 25px; vertical-align: inherit;">Boston | 45 | 27 | 100 | 10 |
| <img src="https://a.espncdn.com/i/teamlogos/nhl/500/ott.png" style="padding: 0 4px; width: 25px; vertical-align: inherit;">Ottawa | 44 | 27 | 99 | 11 |
| <img src="https://a.espncdn.com/i/teamlogos/nhl/500/det.png" style="padding: 0 4px; width: 25px; vertical-align: inherit;">Detroit | 41 | 31 | 92 | 10 |
| <img src="https://a.espncdn.com/i/teamlogos/nhl/500/fla.png" style="padding: 0 4px; width: 25px; vertical-align: inherit;">Florida | 40 | 38 | 84 | 4 |
| <img src="https://a.espncdn.com/i/teamlogos/nhl/500/tor.png" style="padding: 0 4px; width: 25px; vertical-align: inherit;">Toronto | 32 | 36 | 78 | 14 |
2025-26 Metropolitan Division Standings
| TEAM | W | L | PTS | OTL |
|---|---|---|---|---|
| <img src="https://a.espncdn.com/i/teamlogos/nhl/500/car.png" style="padding: 0 4px; width: 25px; vertical-align: inherit;">Carolina | 53 | 22 | 113 | 7 |
| <img src="https://a.espncdn.com/i/teamlogos/nhl/500/pit.png" style="padding: 0 4px; width: 25px; vertical-align: inherit;">Pittsburgh | 41 | 25 | 98 | 16 |
| <img src="https://a.espncdn.com/i/teamlogos/nhl/500/phi.png" style="padding: 0 4px; width: 25px; vertical-align: inherit;">Philadelphia | 43 | 27 | 98 | 12 |
| <img src="https://a.espncdn.com/i/teamlogos/nhl/500/wsh.png" style="padding: 0 4px; width: 25px; vertical-align: inherit;">Washington | 43 | 30 | 95 | 9 |
| <img src="https://a.espncdn.com/i/teamlogos/nhl/500/cbj.png" style="padding: 0 4px; width: 25px; vertical-align: inherit;">Columbus | 40 | 30 | 92 | 12 |
| <img src="https://a.espncdn.com/i/teamlogos/nhl/500/nyi.png" style="padding: 0 4px; width: 25px; vertical-align: inherit;">NY Islanders | 43 | 34 | 91 | 5 |
| <img src="https://a.espncdn.com/i/teamlogos/nhl/500/nj.png" style="padding: 0 4px; width: 25px; vertical-align: inherit;">New Jersey | 42 | 37 | 87 | 3 |
| <img src="https://a.espncdn.com/i/teamlogos/nhl/500/nyr.png" style="padding: 0 4px; width: 25px; vertical-align: inherit;">NY Rangers | 34 | 39 | 77 | 9 |