
New Jersey Devils at Detroit Red Wings
· National Hockey League
5 - 3

Red Wings eliminated from NHL playoff picture with 5-3 loss to Devils

Detroit extended the league's longest active postseason drought, dating to the 2016 season when the franchise earned a berth for the 25th consecutive season in what was a remarkable run that included four Stanley Cup championships.
The Red Wings were in a playoff position for 148 days of the season, according to Sportradar, to raise expectations higher than they've been since the hockey-crazed state has experienced the playoffs a long time ago.
They went ahead against New Jersey in the first, second and third periods — and lost every lead.
On an odd-man rush, Bratt scored the go-ahead goal from the left circle off a perfect pass from Jack Hughes in the right circle with John Gibson flailing around in an attempt to stop the puck. Dawson Mercer added an empty-net goal with a minute left.
Gibson had 27 saves for the Red Wings and Jake Allen stopped 25 shots for the Devils.
Detroit’s Justin Faulk broke a scoreless tie midway through the opening period.
Olympic hero Hughes, playing about 25 miles from where he skated in high school at USA Hockey Arena, scored his 27th goal of the season a minute later.
The Red Wings went back ahead on David Perron's goal with 8:01 left in the second period, but failed to keep the lead again. Bratt scored a game-tying goal, giving him at least 21 for a fifth straight season.
Emmitt Finnie scored a tiebreaking goal seven minutes into the third to put the Red Wings ahead again, but Cody Glass pulled the Devils into another tie midway through the period.
Red Wings: At Tampa Bay on Monday.
Regular Season SeriesNJ wins series 2-1
Scoring Summary
 |
Goal | 1st Period 9:41 | Justin Faulk Goal (15) Snap Shot, assists: Dylan Larkin (32), Emmitt Finnie (17) |
 |
Goal | 1st Period 10:40 | Jack Hughes Goal (27) Wrist Shot, assists: Jesper Bratt (49), Dougie Hamilton (25) |
|
Goal | 2nd Period 11:59 | David Perron Goal (12) Snap Shot, assists: J.T. Compher (16) |
|
Goal | 2nd Period 15:16 | Jesper Bratt Goal (21) Wrist Shot, assists: Johnathan Kovacevic (8), Dennis Cholowski (2) |
|
Goal | 3rd Period 7:00 | Emmitt Finnie Goal (13) Backhand, assists: Lucas Raymond (51), Dylan Larkin (33) |
|
Goal | 3rd Period 11:18 | Cody Glass Goal (19) Snap Shot, assists: Timo Meier (19), Jonas Siegenthaler (16) |
|
Goal | 3rd Period 16:26 | Jesper Bratt Goal (22) Wrist Shot, assists: Jack Hughes (48), Connor Brown (25) |
|
Goal | 3rd Period 19:00 | Dawson Mercer Goal (19) Wrist Shot, assists: Nico Hischier (37), Dougie Hamilton (26) |
Statistics
 NJ NJ |
 DET DET |
|
|---|---|---|
| 11 | Blocked Shots | 14 |
| 13 | Hits | 21 |
| 2 | Takeaways | 3 |
| 33 | Shots | 28 |
| 0 | Power Play Goals | 0 |
| 0 | Power Play Opportunities | 1 |
| 0.0 | Power Play Percentage | 0.0 |
| 0 | Short Handed Goals | 0 |
| 0 | Shootout Goals | 0 |
| 22 | Faceoffs Won | 31 |
| 41.5 | Faceoff Win Percent | 58.5 |
| 11 | Giveaways | 13 |
| 1 | Total Penalties | 0 |
| 2 | Penalty Minutes | 0 |
 Detroit Red Wings Injuries
| NAME, POS | STATUS | DATE |
|---|---|---|
| Viktor Arvidsson, LW | Out | Jul 1 |
| Mason Appleton, C | Out | Apr 15 |
| Michael Rasmussen, C | Out | Apr 7 |
 New Jersey Devils Injuries
| NAME, POS | STATUS | DATE |
|---|---|---|
| Arseny Gritsyuk, RW | Out | Jun 30 |
| Evan Rodrigues, C | Injured Reserve | Jun 30 |
| Jonas Siegenthaler, D | Out | May 4 |
| Brett Pesce, D | Injured Reserve | Apr 13 |
| Luke Hughes, D | Out | Apr 9 |
Game Information
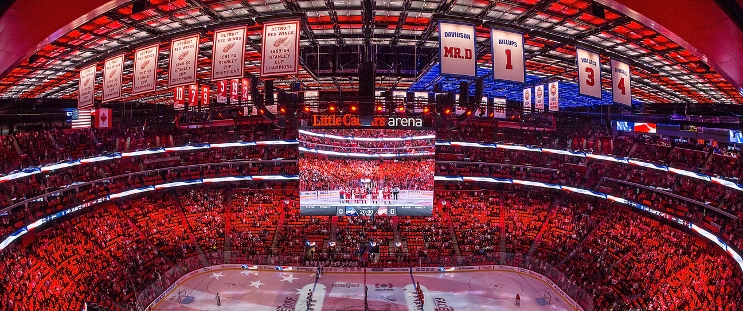 Little Caesars Arena
Location: Detroit, MI
Attendance: 19,515 | Capacity:
Location: Detroit, MI
Attendance: 19,515 | Capacity:
2025-26 Metropolitan Division Standings
| TEAM | W | L | PTS | OTL |
|---|---|---|---|---|
| <img src="https://a.espncdn.com/i/teamlogos/nhl/500/car.png" style="padding: 0 4px; width: 25px; vertical-align: inherit;">Carolina | 53 | 22 | 113 | 7 |
| <img src="https://a.espncdn.com/i/teamlogos/nhl/500/pit.png" style="padding: 0 4px; width: 25px; vertical-align: inherit;">Pittsburgh | 41 | 25 | 98 | 16 |
| <img src="https://a.espncdn.com/i/teamlogos/nhl/500/phi.png" style="padding: 0 4px; width: 25px; vertical-align: inherit;">Philadelphia | 43 | 27 | 98 | 12 |
| <img src="https://a.espncdn.com/i/teamlogos/nhl/500/wsh.png" style="padding: 0 4px; width: 25px; vertical-align: inherit;">Washington | 43 | 30 | 95 | 9 |
| <img src="https://a.espncdn.com/i/teamlogos/nhl/500/cbj.png" style="padding: 0 4px; width: 25px; vertical-align: inherit;">Columbus | 40 | 30 | 92 | 12 |
| <img src="https://a.espncdn.com/i/teamlogos/nhl/500/nyi.png" style="padding: 0 4px; width: 25px; vertical-align: inherit;">NY Islanders | 43 | 34 | 91 | 5 |
| <img src="https://a.espncdn.com/i/teamlogos/nhl/500/nj.png" style="padding: 0 4px; width: 25px; vertical-align: inherit;">New Jersey | 42 | 37 | 87 | 3 |
| <img src="https://a.espncdn.com/i/teamlogos/nhl/500/nyr.png" style="padding: 0 4px; width: 25px; vertical-align: inherit;">NY Rangers | 34 | 39 | 77 | 9 |
2025-26 Atlantic Division Standings
| TEAM | W | L | PTS | OTL |
|---|---|---|---|---|
| <img src="https://a.espncdn.com/i/teamlogos/nhl/500/buf.png" style="padding: 0 4px; width: 25px; vertical-align: inherit;">Buffalo | 50 | 23 | 109 | 9 |
| <img src="https://a.espncdn.com/i/teamlogos/nhl/500/tb.png" style="padding: 0 4px; width: 25px; vertical-align: inherit;">Tampa Bay | 50 | 26 | 106 | 6 |
| <img src="https://a.espncdn.com/i/teamlogos/nhl/500/mtl.png" style="padding: 0 4px; width: 25px; vertical-align: inherit;">Montreal | 48 | 24 | 106 | 10 |
| <img src="https://a.espncdn.com/i/teamlogos/nhl/500/bos.png" style="padding: 0 4px; width: 25px; vertical-align: inherit;">Boston | 45 | 27 | 100 | 10 |
| <img src="https://a.espncdn.com/i/teamlogos/nhl/500/ott.png" style="padding: 0 4px; width: 25px; vertical-align: inherit;">Ottawa | 44 | 27 | 99 | 11 |
| <img src="https://a.espncdn.com/i/teamlogos/nhl/500/det.png" style="padding: 0 4px; width: 25px; vertical-align: inherit;">Detroit | 41 | 31 | 92 | 10 |
| <img src="https://a.espncdn.com/i/teamlogos/nhl/500/fla.png" style="padding: 0 4px; width: 25px; vertical-align: inherit;">Florida | 40 | 38 | 84 | 4 |
| <img src="https://a.espncdn.com/i/teamlogos/nhl/500/tor.png" style="padding: 0 4px; width: 25px; vertical-align: inherit;">Toronto | 32 | 36 | 78 | 14 |